Rates
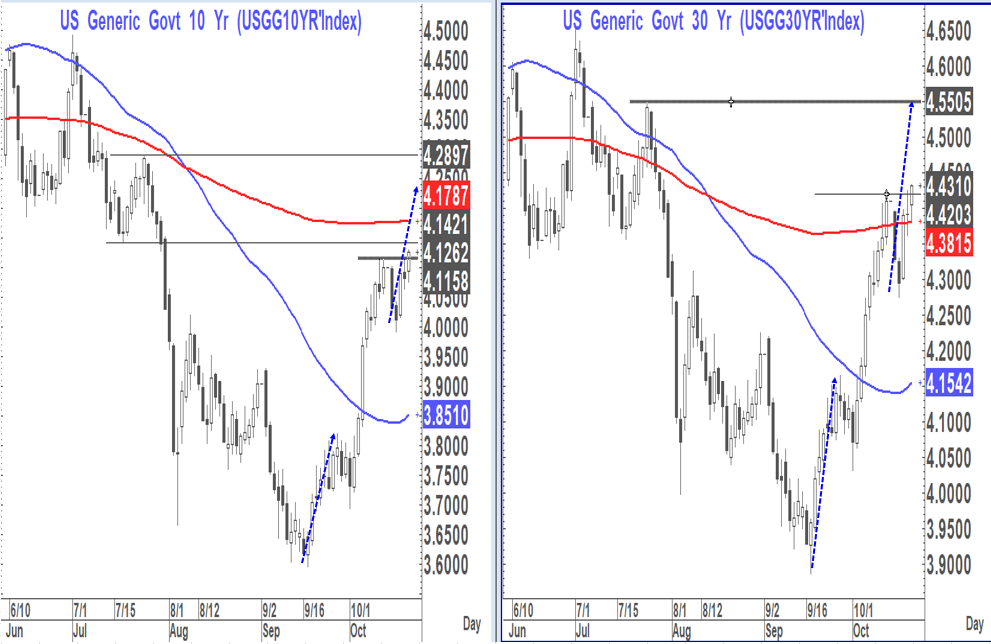
It feels like yields want to head higher particularly in the longer end of the curve. The 10 and 30 year yields have moved to new highs in the move and look in danger of heading higher still
For now, despite the fact that it has worked spectacularly well I think we need to move the 2007 analog to the background for now as other things are driving markets today- particularly Geopolitics and now even more so Politics as mentioned in Diary Week 64: Donala at the weekend.
On the 10-year yield there is some resistance around 4.14% as well as at the 200-day MA at 4.18% but a measured move target suggests 4.22% may be possible with an extended target at 4.29%.
On the 30-year yield we are again back above the 200-day MA (suggesting it may not hold on the 10's) and a measured move target would suggest 4.55% which is also horizontal resistance
FX
IF this is correct then likely the USD is going to hold up also
The USD-Index (DXY) hit its 103,65-85 target and paused but as yet this does not look like a reversal. Above this range, if seen, would suggest extended gains towards 104.72-104.80 (76.4% pullback and horizontal resistance)

This may also suggest that the caution suggested on USDJPY is a little premature and it might manage to make a marginal new high in the move over 150.32 with the 200-day MA at 151.33. However, the momentum divergence is still in play and a possibility of triple momentum divergence on a marginal new high also exists
In addition, we also have the possibility of bearish outside days on AUDUSD (below .6693) and NZDUSD (below .6053)
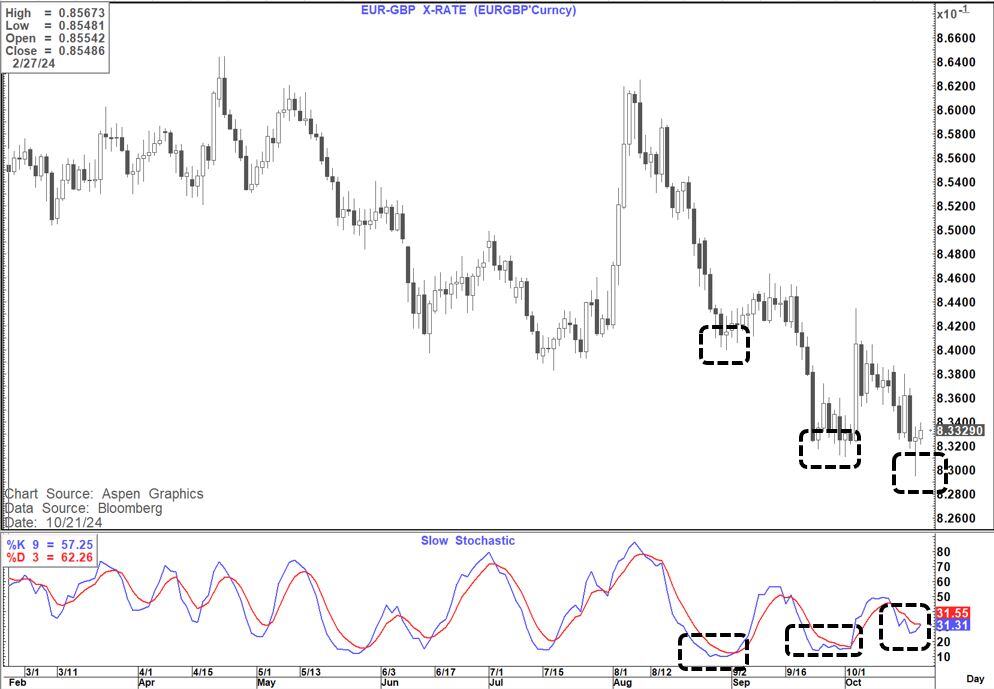
Outside of the USD one of the more interesting charts remains EURGBP. I covered this in detail in the piece Twins on October 18th and we are now on the cusp of completing the triple momentum divergence on the daily chart
Commodities
The monthly picture on the Bloomberg Commodity Index still looks constructive with triple momentum divergence (positive) still looking likely at the end of October. I covered this in This Could Be A Big Deal on 18th October
Copper has bounced further this morning and a test of $450 looks likely.
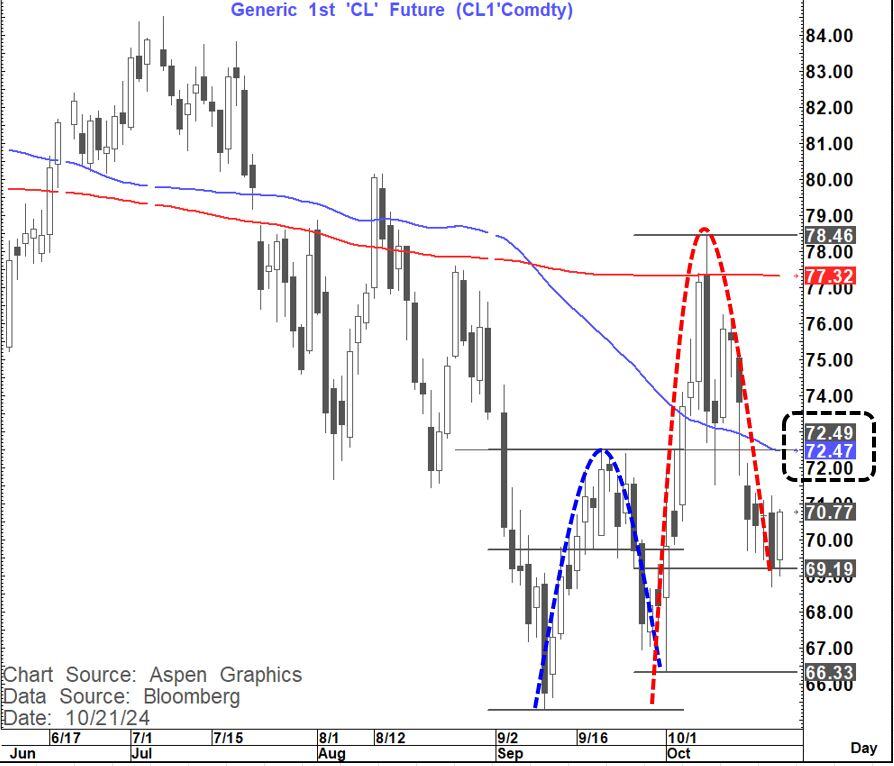
However, it is the Oil chart that is again looking interesting.
WTI has traded in a way that is very similar to what we saw into early October. In both instances we saw a strong rally that then retraced to and slightly below the 76.4% pullback area but without a close below.
In early October WTI then surged again and hit $78.46 a week later after a low of $66,33 on 01 October. We have started to bounce here and a close above $72.50 would suggest we could be on the cusp of another rally back to and possibly above that October peak.
The overall picture remains constructive on Gold (new all-time high today) with the $3,000+ target still well intact and Bitcoin which also hit a new high in the move today (but still trades close to Equities which has softened today). A new all-time high and more still looks likely here.
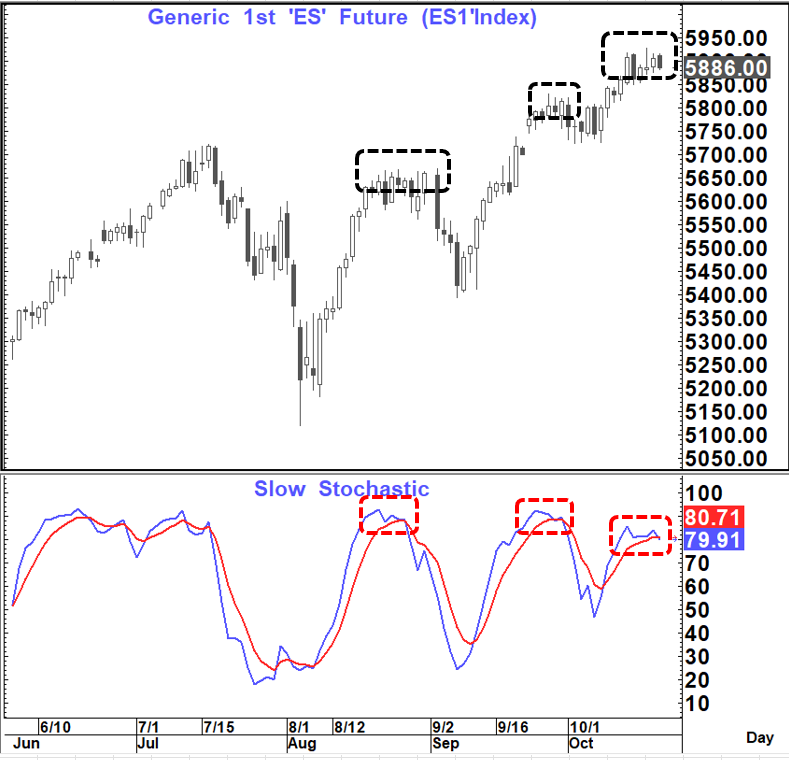
Equities
The trend remains your friend here BUT if this early down move is sustained, we are online for triple momentum divergence (negative) on the daily chart. Such a development would suggest the danger that we could correct lower in the short-term to at least 5,830 and POSSIBLY as low as 5,720-5,725....WATCH THIS SPACE