
I have been articulating a positive view for some time on Gold, Bitcoin and to a certain extent Oil and Natural gas.
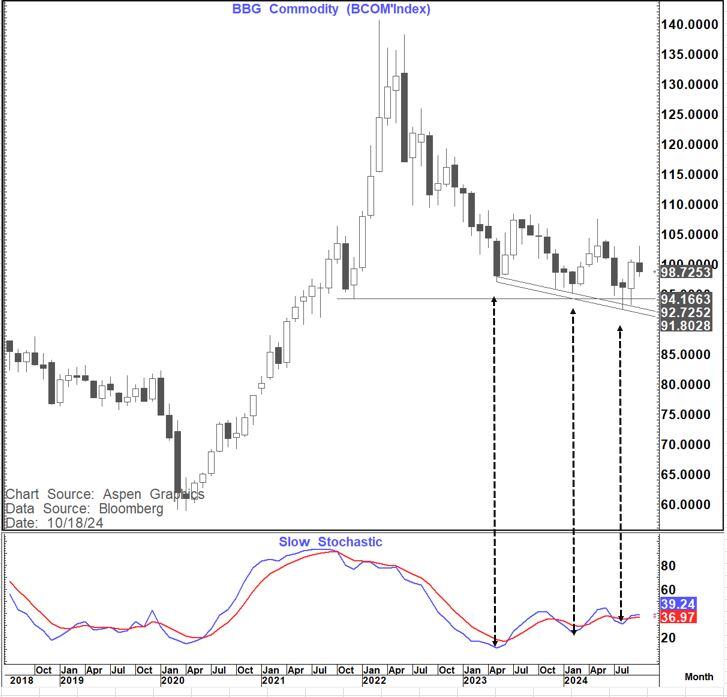
However, the chart below is intriguing as it suggests we could be on the cusp of a much more broad-based commodity up move
It is the chart of the Bloomberg Commodity Index 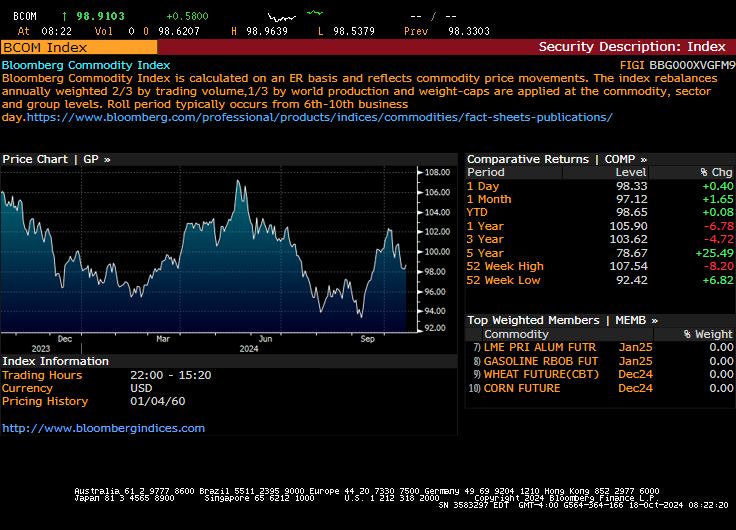
https://assets.bbhub.io/professional/sites/27/BCOM-The-Commodities-Benchmark_July2024_final.pdf
Looking at the chart below we have a DANGER of one of my 3 favourite indicators developing on the monthly chart- Triple positive monthly divergence .
That happens when at the low or high of the move (in this case the low) we get this divergence between price and momentum.
On price we see a low followed by a lower low followed by a lower low. On momentum we see (In oversold territory) a low followed by a higher low followed by a higher low.
This has developed over nearly 18 months and IF completed at the monthly close would suggest a major turn higher.
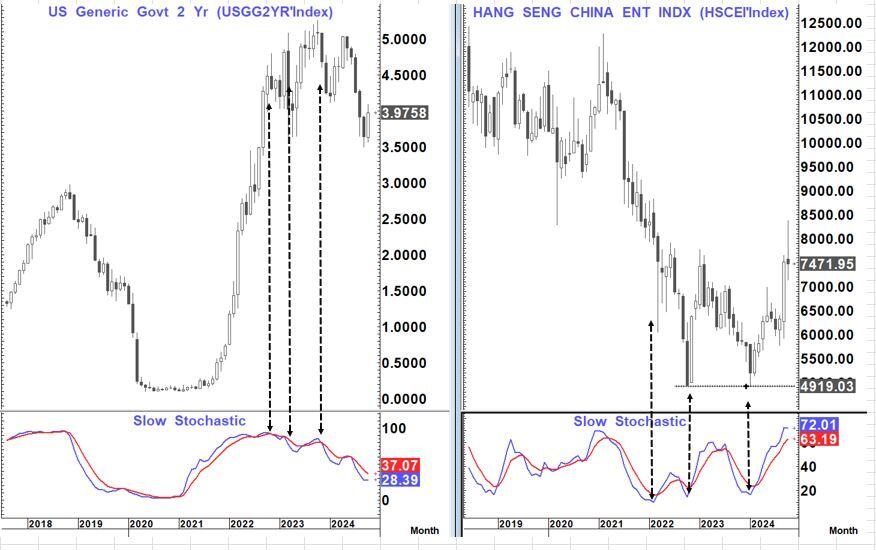
It is VERY RARE to see this on a monthly chart and 2 examples are below and we can see what happened next. On the US 2-year yield we got this development at the high for the first time in history and on the HSCEI recently we saw pretty much the same development
We clearly need to watch this closely into year end and IF it completes even more so in the months ahead.