One of the most interesting charts right now is USDCAD as it has developed a set of building blocks that are very constructive for the "Loonie"
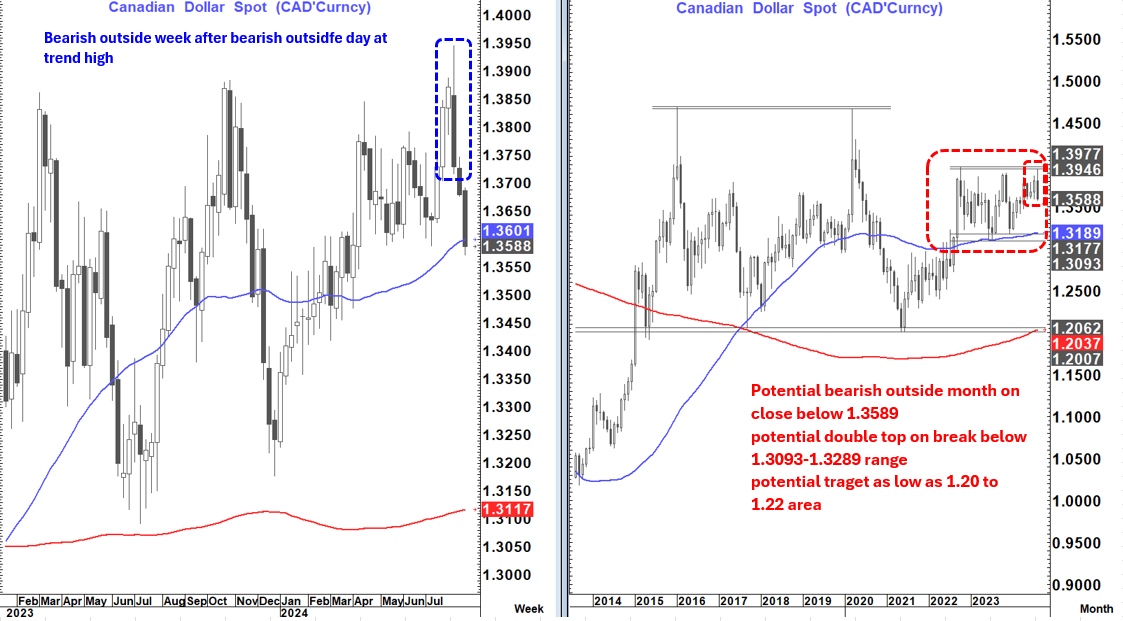
- It firstly peaked at 1.3946- very close to the 1.3977 peak seen in October 2022.
- Off that double-top it posted a bearish outside day and then a bearish outside week.
- It is now testing good supports at 1.3594 (200-day MA) and 1.3589-1.3592 (Horizontal support) and is below the 55-week MA at 1.3601.
- IF it closes the month below 1.3589 it will be a bearish outside month at the high of the trend.
- Such a close would suggest a move to at least test the double-top neckline, horizontal support and the 55-month and 200-week MA's at 1.3093 to 1.3189.
- A break below that range extends the potential towards at least 1.2210-40 with major support and the 200-month MA at 1.2007-1.2062
- All this fits with the recent piece titled Diary Week 55: Are The Sands Shifting For The $? which suggests the potential for a double-digit percentage broad based fall in the USD
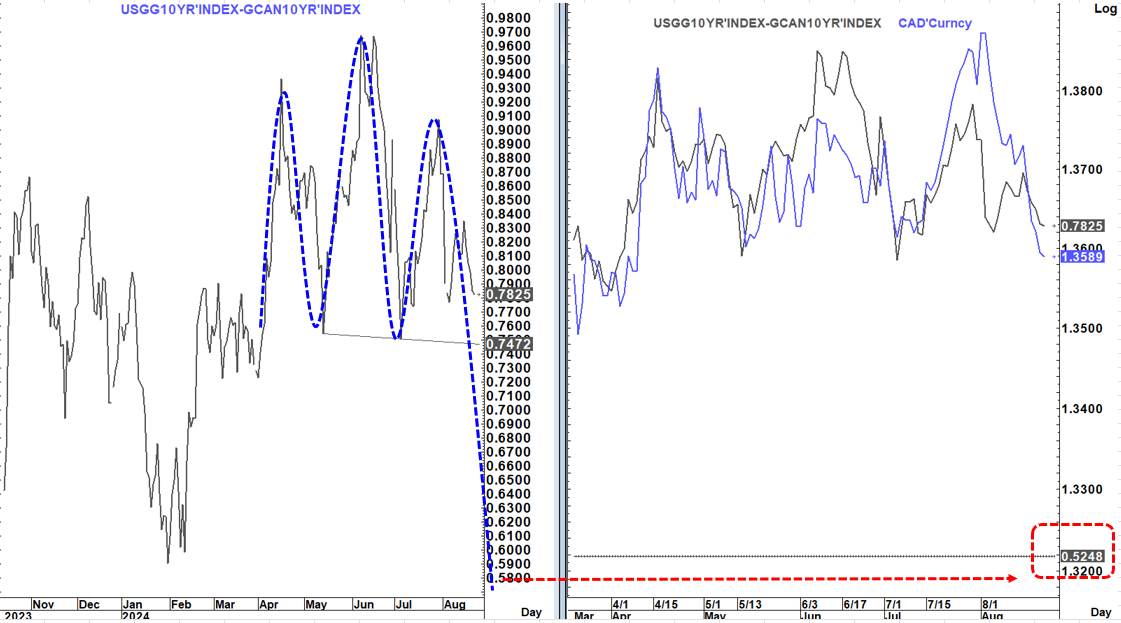
This at a time when the US/Canada 10-year yield spread looks in danger of forming a heads and shoulders top IF it breaks below 75 bp's that would suggests move to at least 53 bp's and a USDCAD rate consistent with our first set of targets around 1.31-1.32