
FX is a relative trade with many moving parts and at least 2 sides to the argument (The 2 currencies involved)
To date, despite my view on yields (lower), equities (higher for now but susceptible later), The US economy (weakening) and in particular employment (rolling over) I have HAD a bias that the USD might behave like the best house on a bad street
As I take one step back, I am not so sure of that anymore - especially over the next 6 months or so.
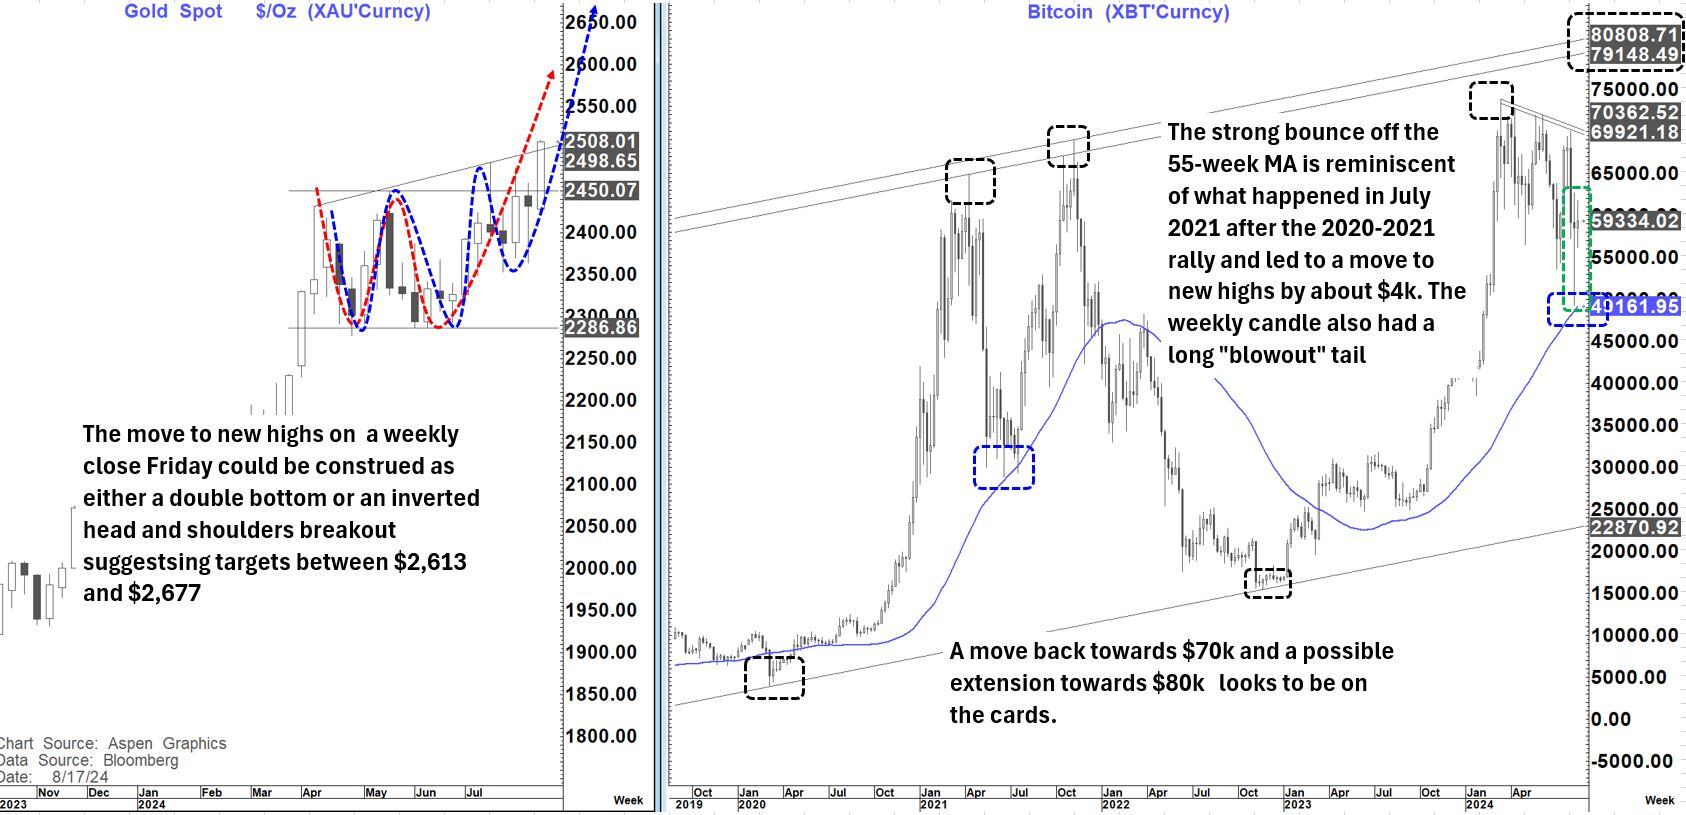
Are Gold and Bitcoin telling us something? Gold is back right on the cusp of a breakout despite some recent choppy trading and above $2,500 looks to open up the potential for accelerated gains again. Bitcoin has been even choppier but also looks like that "chop" will be resolved with another move higher.
Is the US now playing catchup to the "struggles" seen elsewhere where they did not have the buffers to absorb like the US had (Huge monetary stimulus, Fiscal stimulus, High savings rate, cheap fixed rate long term mortgages and business loans, flight to quality etc. Etc.?)
One could argue that that is why we saw the USD surge in 2021-2022 but since then it has firstly struggled and for the last year consolidated.
Those buffers are now effectively gone, and the question is.......
Is the $ about to struggle again? I think the answer now is YES.
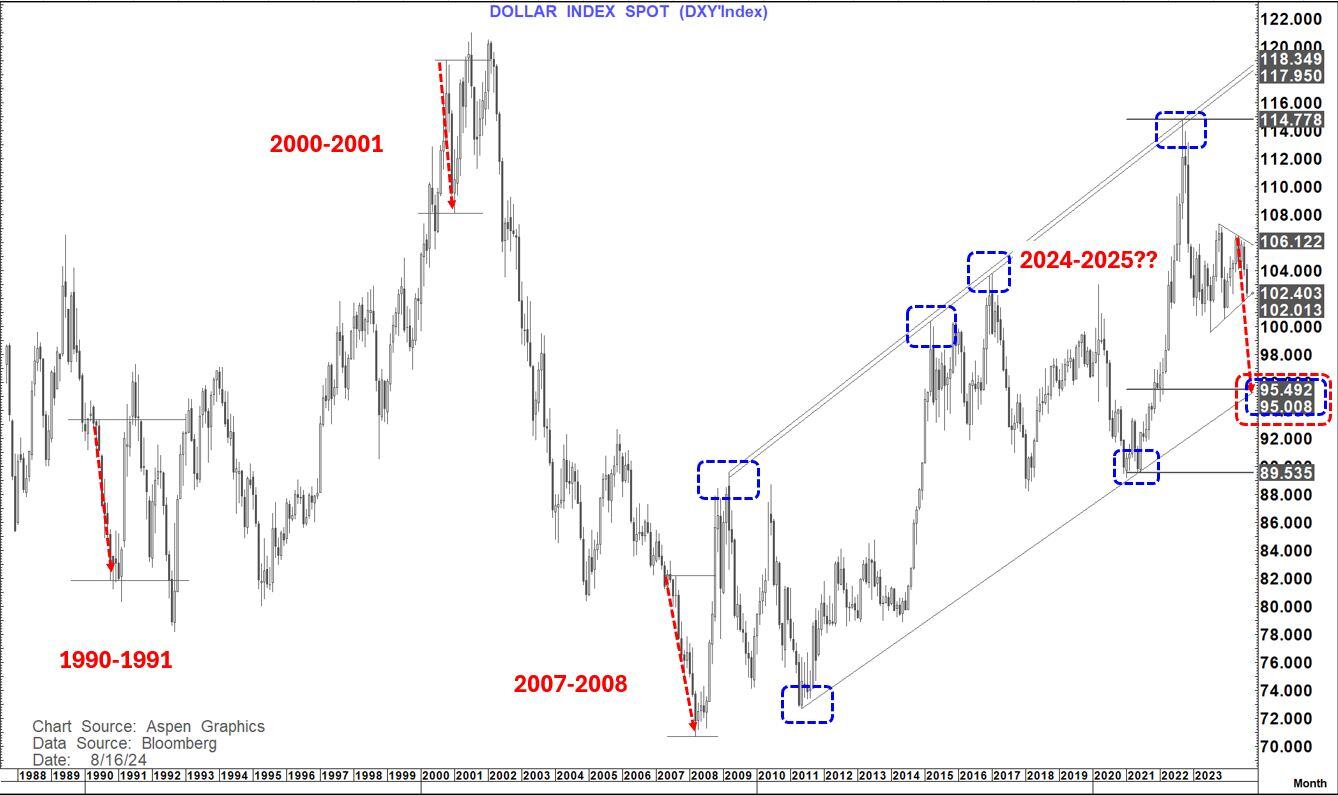
When one looks at the chart below there is a strong sense that we could be drawing to the end of that 1-year consolidation and that contrary to what I have previously thought that the breakout may be to the downside.
The thought process here is twofold.
Firstly, the last 12 months are now increasingly looking like a narrowing triangle/consolidation and we are very close to the base of that consolidation at 102.
Secondly, I have long talked about the 3 working analogs-
1990- Japan
2000- The DotCom bubble, the Fed holding rates at 6.5% (higher for wronger) and real rates at 400 bp's
2007- The move towards the GFC-Not that I am looking for such an event but now as then it appears the Fed has again been stubbornly higher for wronger.
As I have constantly noted the US 2-Year yield is tracking that period in lock step- something I covered yet again in my Friday note titled You cannot Make This Up (Link)
So, when looking at this long-term USD-index chart it was worth reminding myself what the USD did from the middle of those 3 years in question.
1990
From June 1990 to Feb 1991 the USD index fell high to low about 12.25%.
That coincided with the renewed fall in USDJPY from 156 to 124-about 20% after it had an almost 7 big figure bounce after the initial fall from above 160. The Nikkei also began its collapse from 40k
During that period, and beyond, the Fed was cutting rates as the BOJ was hiking. That dynamic may have shifted more one sided now possibly mitigating the magnitude of the fall we might see but not the direction. EURUSD (as its pre-EURO components) went up from 1.24 to 1.44 (About 16%)
Starting in the week of 16 July 1990 the S&P fell 20% into October 1990.
2000
From October 2000 to January 2001 the USD Index fell high to low about 9.2%.
That coincided with the Fed being stubborn and refusing to ease even as the employment picture deteriorated leading to a renewed fall in the Equity market that began on 01 Sept 2000. That was not a USDJPY move lower but came from a surge in European currencies with EURUSD rising about 16.5%
Starting in the week of 17 July 2000 the S&P fell 7% into the end of July before rallying back to 01 Sept. It then had a renewed fall of 18% into mid December and more in 20001, as the Fed "held the Maginot Line"
2007
From August 2007 to March 2008 the USD-Index fell high to low about 13.9%.
During that time USDJPY fell 20% having initially turned sharply lower in July. Also, EURUSD moved sharply higher from 1.34 to 1.59 (Over 18%)
Starting in the week of 16 July 2007 the S&P fell 12% into mid-August before regaining all its losses into early October as the Fed cut 50 bp's on 18 Sept 2007
It then commenced another move lower that saw it 19% off the highs by Jan 2008
As we sit here today
The USD-Index as mentioned above has been falling since the 106.05 peak in July and is close to the base of the 12 month + consolidation at 102. A break below there would suggest the possibility that it could fall sharply with significant trend line and 76.4% support at 95.00-95.50.
Such a move, if seen, would be a fall in the region of 10 to 10.5% with the range of the 3 prior periods being 9.2% to 13.9% and an average of about 11.8%
Starting in the week of 15 July 2024 the S&P fell 10% into early August and has rapidly been regaining those losses
One other common denominator in all those years that is frankly very hard to envisage this time is that in August of all those years (early Sept release) NFP printed a NEGATIVE number.
I honestly do not think that is remotely likely this time. However, I do not think that is a bar we need to climb.
If we get a sub 100k print that will be the first time that has happened since Jan 2021 (The last negative print was in Dec 2020).
That and or a rise to a 4.4% unemployment rate would be enough, in my view, to potentially put 50 bp's back on the table at the 18th sept meeting.
In 1990 August unemployment rose 2/ 10ths (5.7%) after a 3/10ths rise in July,
In 2000 it rose 1/10th (4.1%) after a prior unchanged in July and
In 2007 it was unchanged (4.6%) after a prior 1/10th rise in July)
It could be different this time and if we get a robust employment report in 3-weeks it will certainly raise questions at least for now.
But given these dynamics I am not inclined to bias towards the idea that "It's different this time" Certainly not at this point.
So, with all of the above it is clearly time to come off the fence and become a "decisive $ Bear" anticipating the potential for a double-digit percentage loss in the USD-Index in the months ahead.
An Audio version of this piece is linked below.