A lot of market moves this morning and a lot of good levels to watch in a big shift from yesterday morning when there was little compelling outside of the Gold and Oil charts.
Here are the highlights.
Yields
US 2-year yield is back below 4.20% but will still find it hard to stray far from 4.25% unless the market starts to see another cut as relatively imminent.
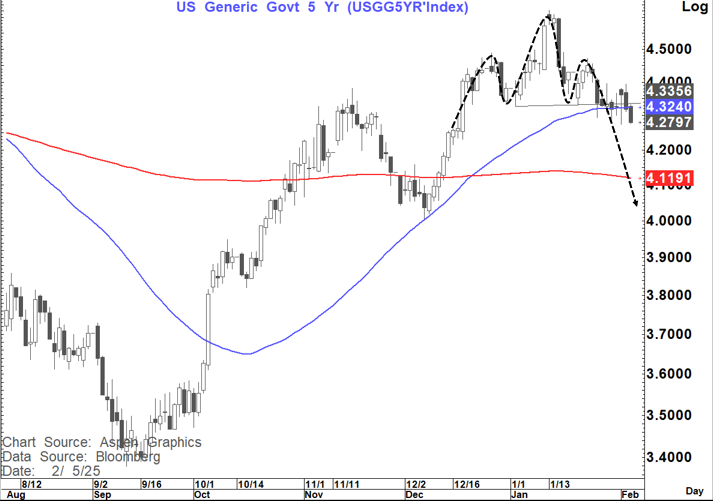
US 5-year yield: Is back below the head and shoulders neckline (4.34%) and the 55-day MA (4.32%)
I retain a bias for lower yields and on 5's that is for a move to at least the 200-day MA at 4.12% and possibly the head and shoulders target/horizontal support at 4.00-4.03%
On 10's we are also below the pivotal 4.49-4.50% area. IF this break is sustained it opens up the way for a move towards the 4.23-4.25% target
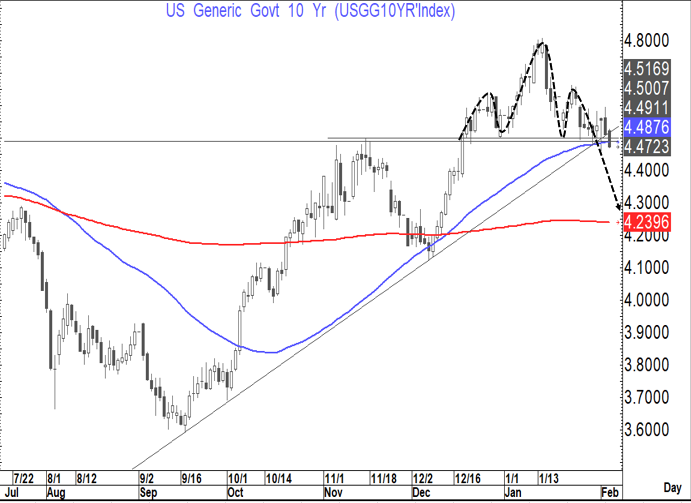
On 30's the big levels are intact for now and stand at 4.67-4.69%
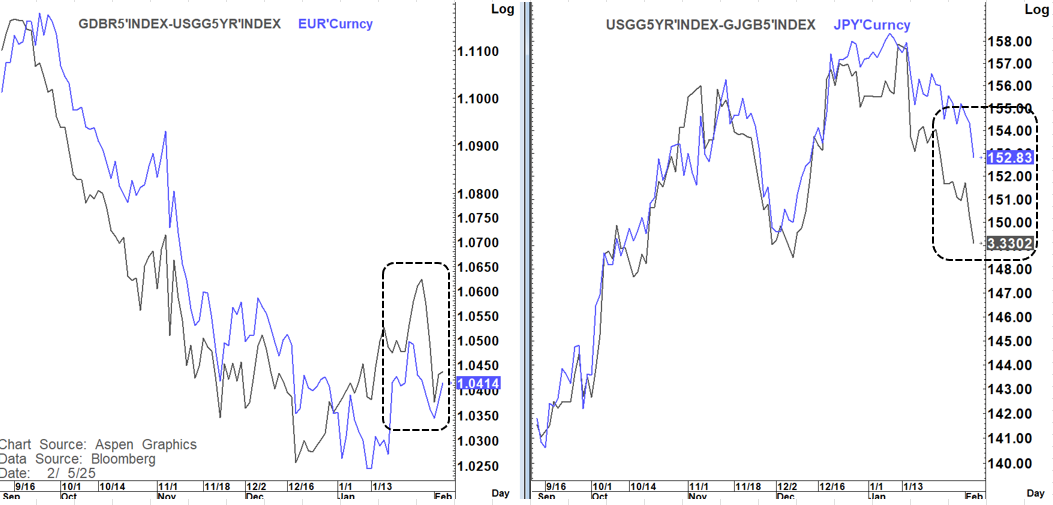
ON yield spreads (5-year) we see increased narrowing today suggesting further USD weakness. Clearly as per the charts below USDJPY (despite the overnight fall) is still more out of line than EURUSD suggesting we should be below 150.
IF yields continue to fall further as expected and spreads narrow further I would expect further USD weakness.
The piece yesterday titled IF The Shoe FITZ: Did King $ Just Hit A Brick Wall? focused on the Bloomberg USD-Index and the POTENTIAL for further significant USD losses.
Some levels to watch in that respect:
FX
EURUSD looks like it could go back to re-test 1.0533 and IF that was broken decisively as far as 1.09 could come into play.
The DXY (USD Index) is testing the 107.35 (breakout area) and 106.97 (possible bearish outside week below) levels. A sustained move below here would suggest extended weakness.
USDJPY has hit the 200-day MA at 152.80 but still looks set to move lower. 151.50 would be the next level to focus on and below here 148.65-149.25
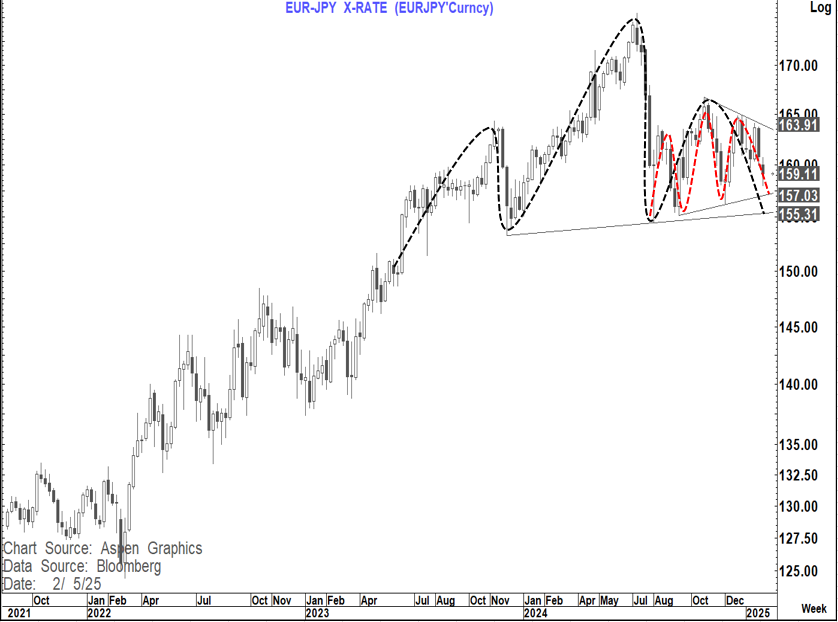
Given the dynamic on yields this supports the renewed pressure we are seeing on EURJPY. Levels to target below are 157 and then 155.30. Below that latter level and the chart would look structurally bearish medium term which would seem to suggest a much lower USDJPY
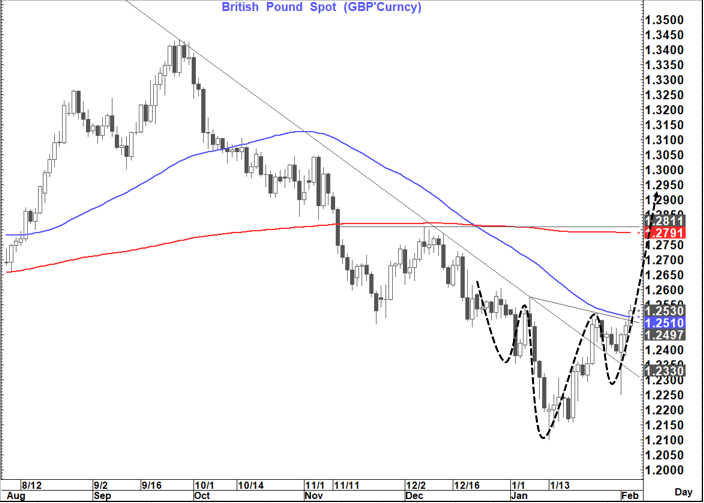
GBPUSD is also starting to look bullish as it both completes an inverted head and shoulders and breaks above the 55-day MA.
This suggests a move towards 1.2790-1.2810 is possible and maybe as high as 1.2950
This as the whole down move from the September high (when US yields started to turn materially higher) looks like a completed 5-wave bearish sequence
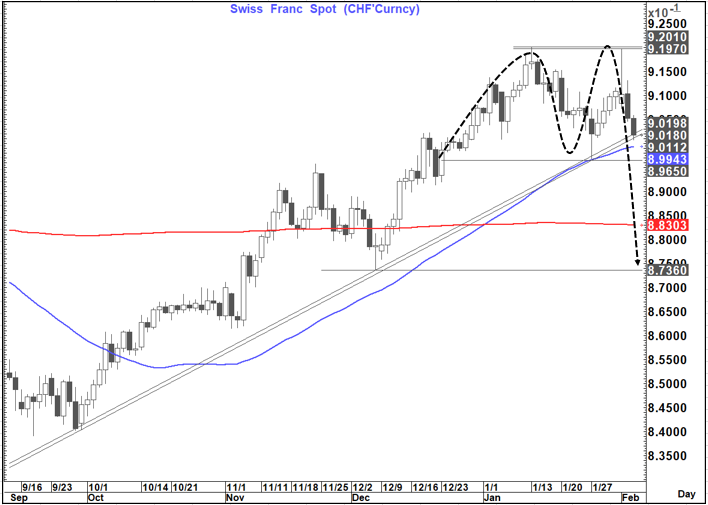
USDCHF is close to joining the USD block party
With trend line support under pressure and the 55-day MA (.8994) and a double top neckline (.8965) just below- a break of this range would suggest a move towards .8830 (200-day MA) and possibly .8730-35 (Double top target and horizontal support
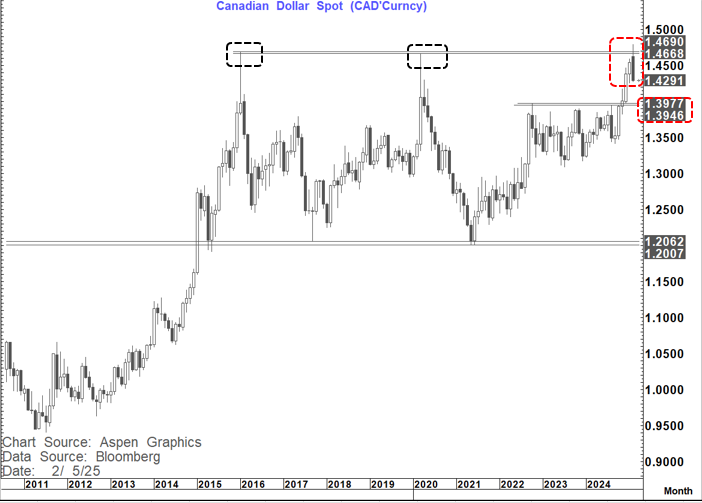
USDCAD continues to fall in a fashion similar to the turns of 2016 and 2020. We now have the possibility building of a bearish outside week (close below 1.4331) and further down the live a bearish outside month (close below 1.4261). In addition, it is testing the 55-week MA at 1.4288 with the 200-week MA at 1.3864
All this suggests that if we see these weekly/monthly developments take place a move towards 1.3946-77 (breakout area) could be on the cards.
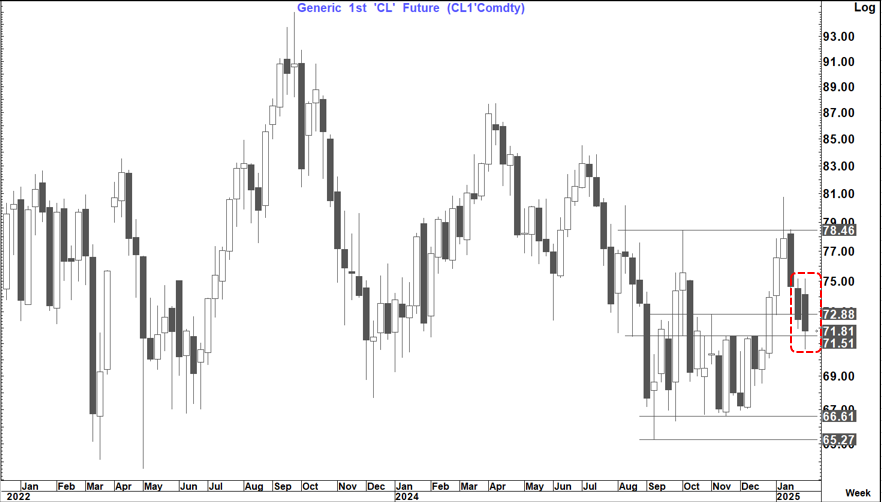
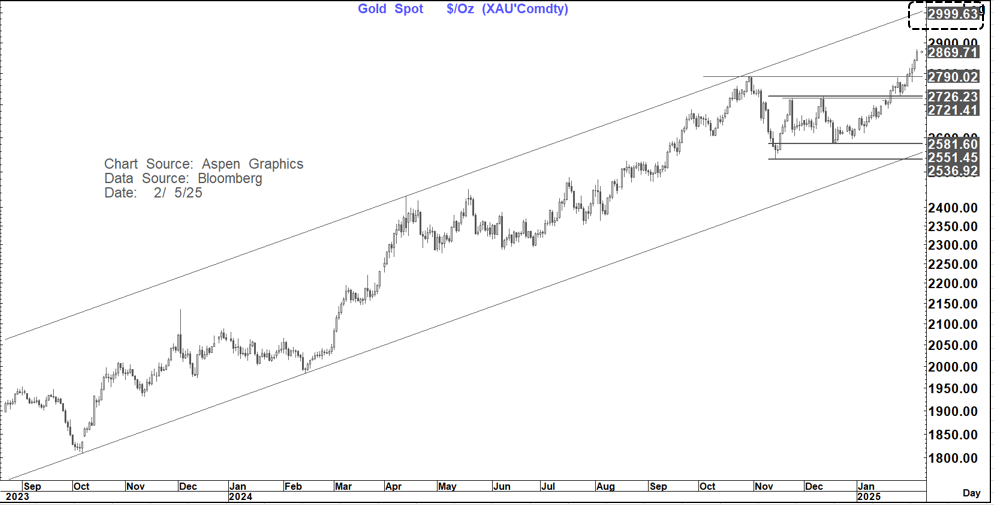
Gold remains bid and I am still looking for a move well above $2,900 and possibly close to $3,000
WTI is back testing good support (prior resistance at $71.50) A close below there opens up the way for further losses. initial support is met at $69.95 (76.4% pullback) and below there a move back towards $65-$67 looks likely (which should also contribute to downward pressure on US yields.
In addition, a close this week, if seen, below $71.94 would be a bearish outside week, further supporting this view.