
This piece focuses on the price action we have just seen on the Bloomberg USD-Index. (BBDXY)
This index is more broadly based that the DXY Index which has a very heavy "EURO/Europe" weighting.

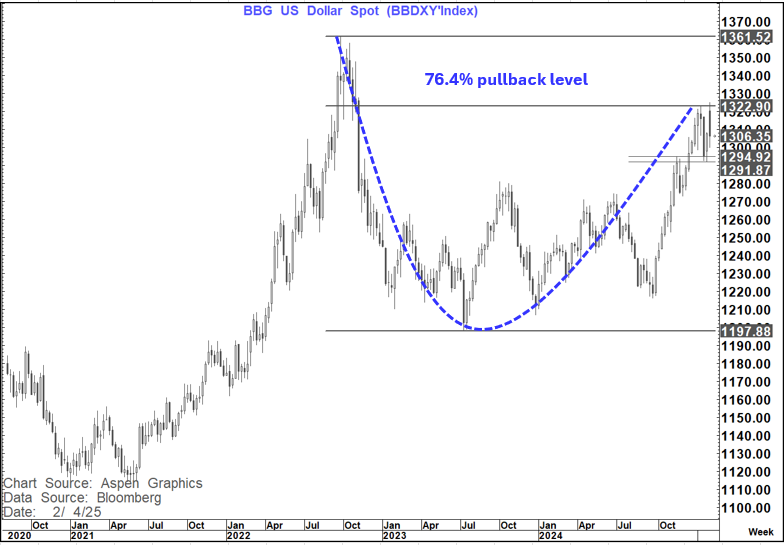
The very recent move higher in the BBDXY once again tested the 76.4% pullback level (previously tested on 13th January). This time around it traded marginally above that level for about 4 hours on Sunday night before turning lower.
The 76.4% retracement level is one of my favourite indicators and the question now is whether this is a "Big hold"?
Additional developments to watch in that respect are:
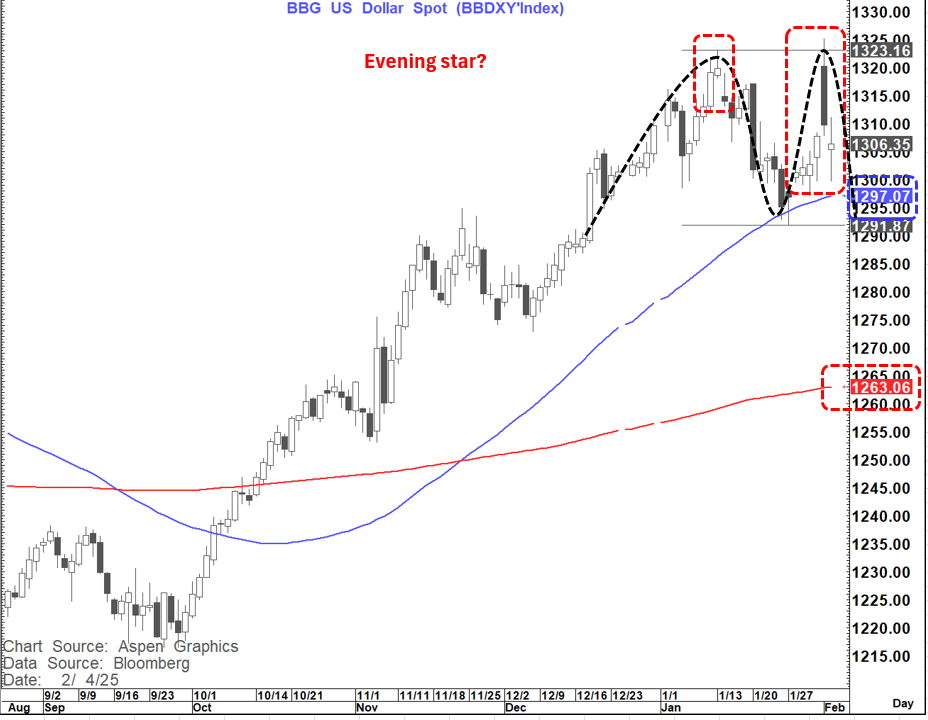
The present daily pattern, if sustained into the close, looks like a bearish evening star formation somewhat similar to what we saw when we turned off this level the last time.
We have been above the 55-day MA on a closing basis since 04 October (4 months). It was extended to it at the peak and opened up a wide 55–200-day MA gap. This another one of my favourite indicators. A close below the 55-day MA (1,297), if seen, would suggest a move towards the 200-day MA presently at 1,263
We have the potential to complete a double top if it closes under 1,292 that would suggest a target of 1,261
In addition, points to watch are:
A weekly close below 1,292, if seen this week, would be a bearish outside week at the high of the trend further validating the idea of a more significant move lower.
A monthly close below 1,292, if seen in February, would be a bearish outside month at the trend high.
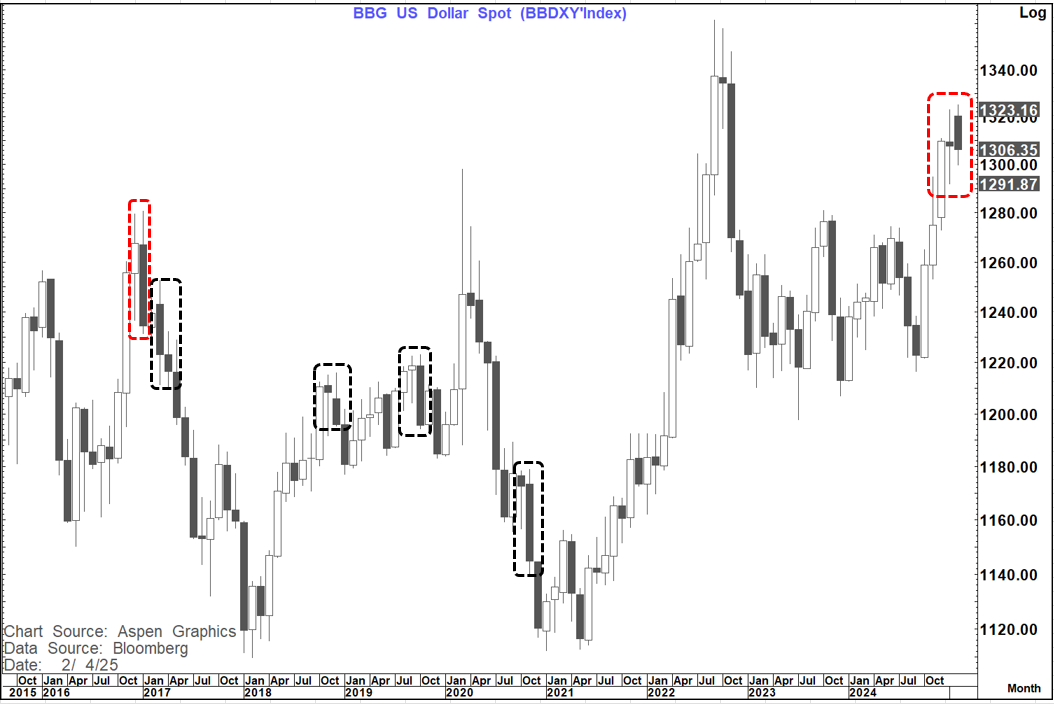
That, interestingly, is what happened in January 2017 at the high of a multi-month bull market.
This month and January 2017 are highlighted in the red boxes below while other bearish outside months posted in the last 5 years are highlighted with black boxes.
This is not to say that we have established an unequivocally bearish multi-month picture at this point for the USD but rather draws attention to the possibility that the building blocks for this could be forming and need to be watched