What look to be the best charts across assets to watch most as we start the week?
In Fixed income...
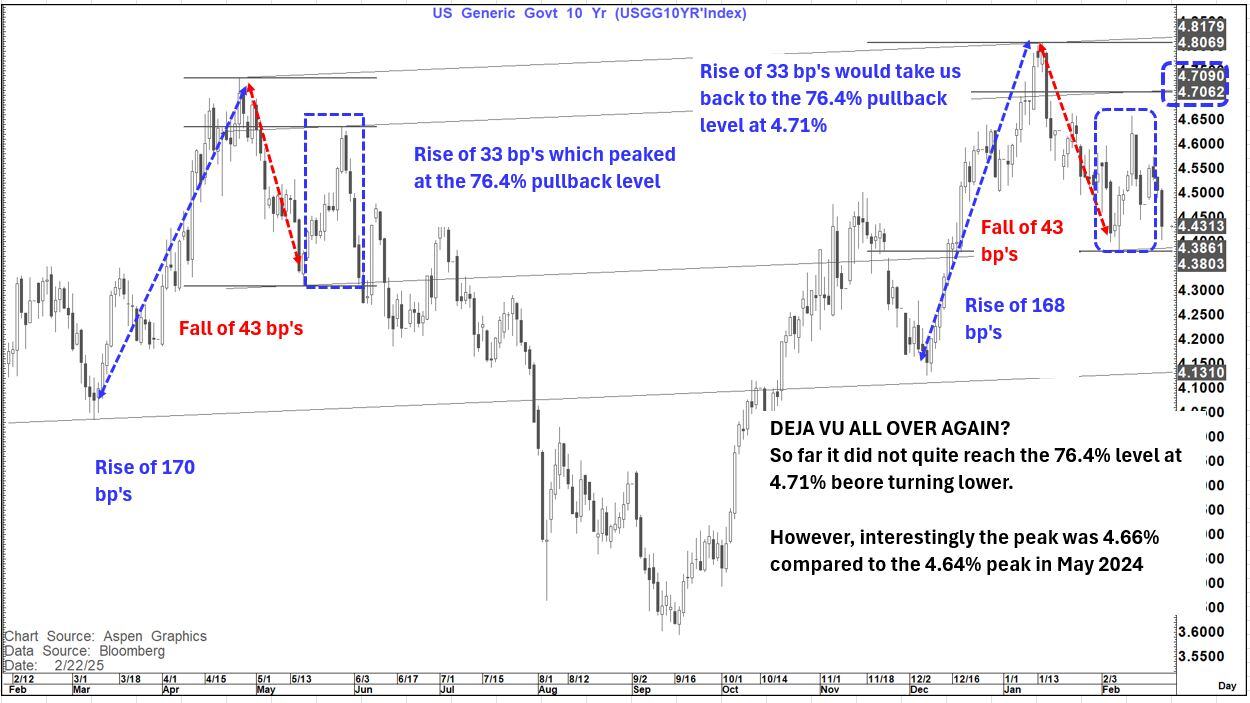
Clearly the chart most in focus is the US 10-Year yield and its similarity to May 2024 as detailed in Diary Week 81: The Magnificent 7
While not identical to the rally and turn lower in yields last year it is very close and so the 4.38% to 4.39% area looks very pivotal with a break below suggesting we could move lower towards 4.20% or below quite quickly.
In FX
Again, as mentioned in this week's Diary there are many good FX charts but the one that stands out is the BBDXY (Bloomberg USD-Index)
Here we have seen technical building blocks build as US yields have fallen and spreads with Europe have narrowed.
It started with a break of the 55-day MA suggesting a move towards the 200-day MA (1,265) and grew from there.
This was followed by a double top that targets a move towards or below 1,260.
Now we are awaiting the "Icing on the cake". IF we close on Friday below 1,291.87 we will have a bearish outside month off a perfect 76.4% pullback after a multi-month move higher.
If anything, this is an even stronger reversal than seen with the bearish outside month in Jan 2017 which ultimately resulted in a fall of over 13% in this index over the subsequent year- with most of that fall coming over just 7 months.

In Commodities
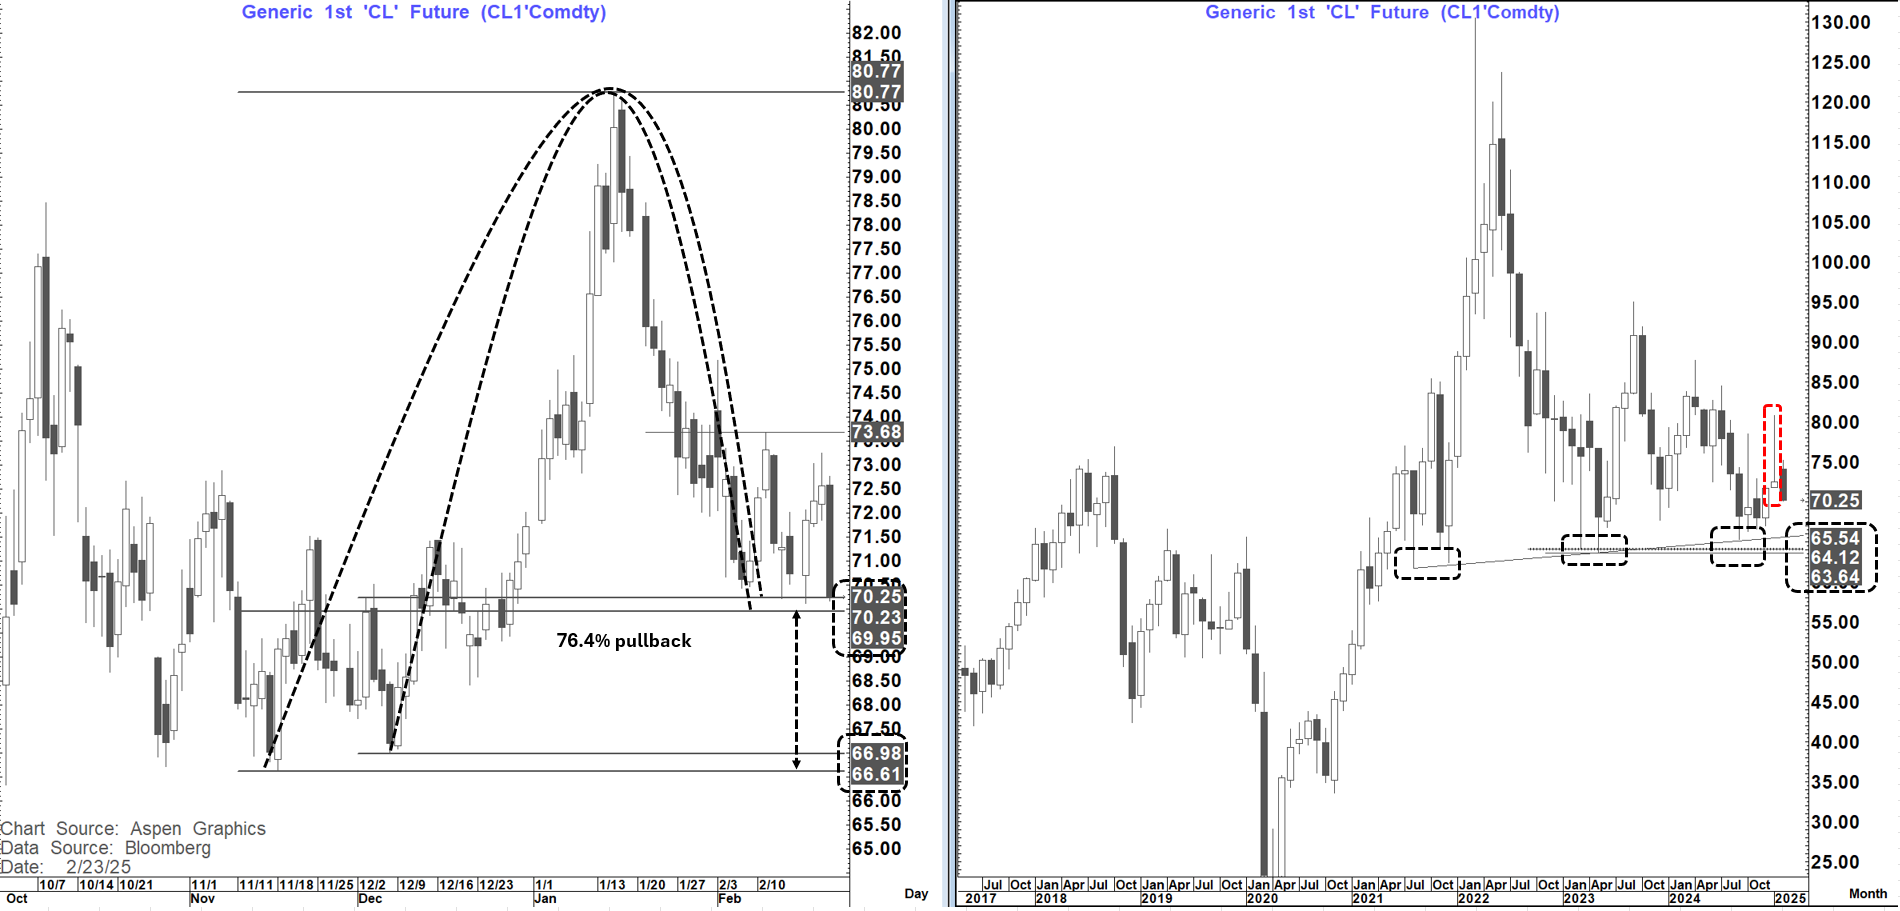
Here we are back to CL1 (WTI) which for the 2nd time failed to make a sustained break of good resistance on a strong rally and is now back at the trend lows.
Depending on where you draw your starting point the 76.4% of the whole Nov/Dec to January rally stands at $69.95 to $70.23 and we closed on Friday at $70.25.
A decisive close below this range (weekly close) if seen would suggest a move to at least the Nov-Dec 2024 lows at $66.61-$66.98
Below there major pivotal support is met at $63.64 to $65.54 which could be tested following the huge inverted monthly hammer seen last month.
IF that range gave way (It is a multiyear support range so a monthly close would be needed to be decisive- probably too much to expect this month) then there would be a danger of a much lower oil price. For that to happen I suspect we would need a very material piece of very negative Oil news.
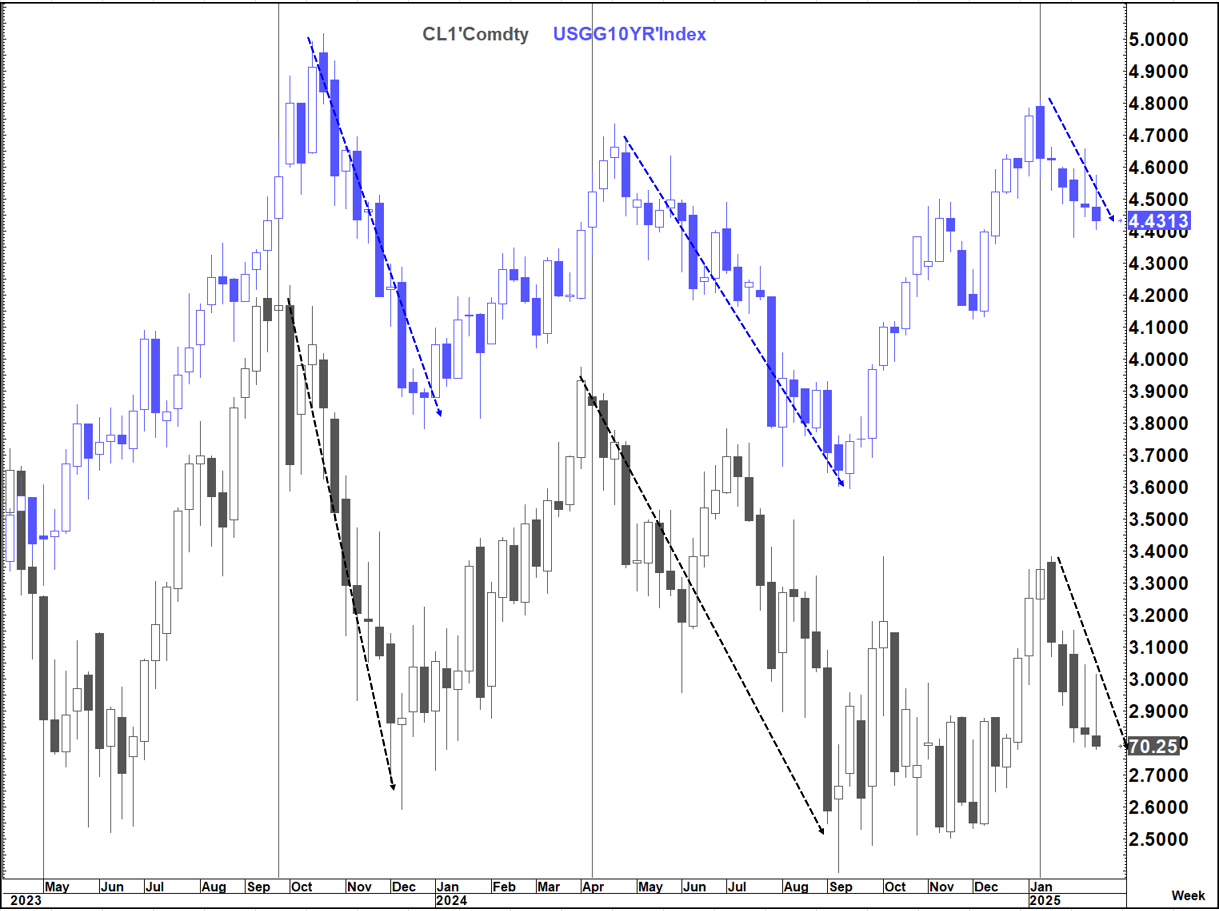
It should be noted that the sharp move lower in Oil in both 2023 and 2024 was clearly instrumental in "helping" long-end yields move lower and that levels in the mid $60's in Oil coincided with levels in the 3.60-3.80% range in the US 10-year yield
In Equities
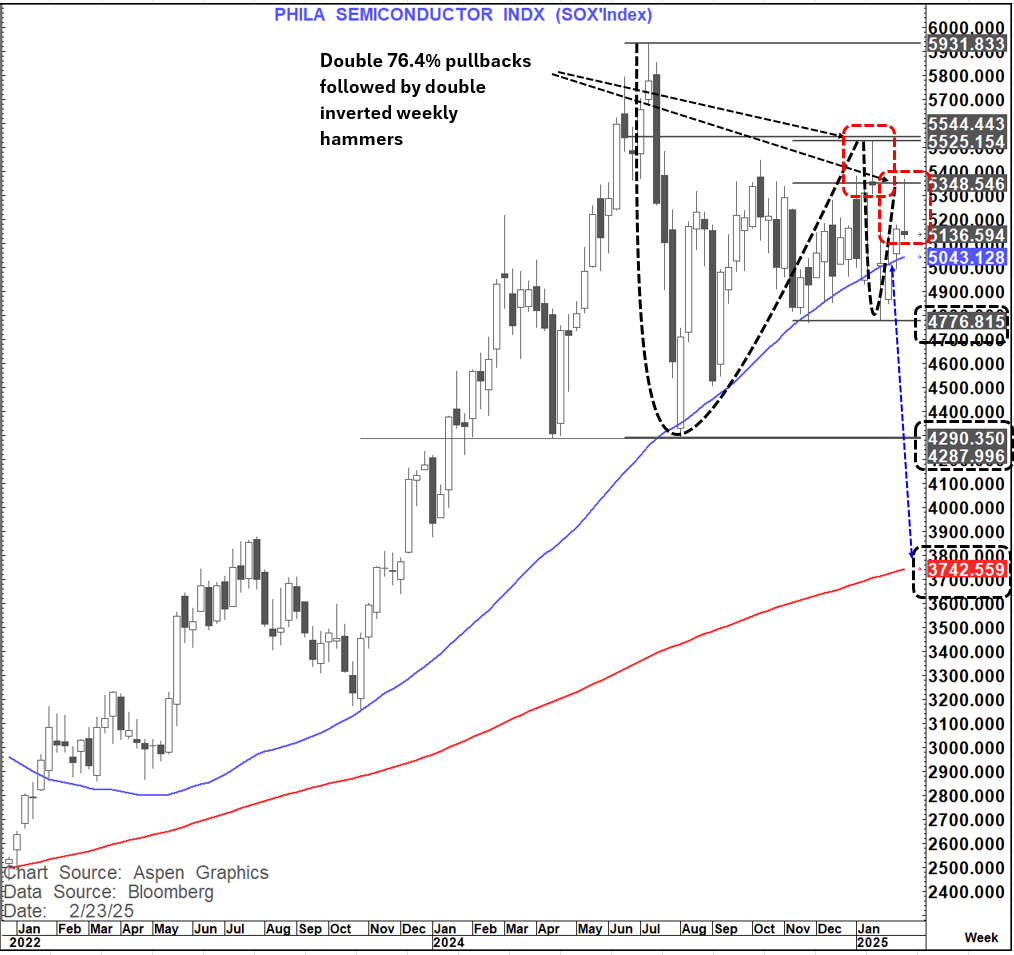
The SOX Index (Philadelphia Semiconductor index) is the chart I am look at most closely here. It does not yet have a categoric bearish medium-term signal BUT.....
It posted a major 76.4% hold at the high in January followed by a secondary 76.4% hold at the high last week- both with very decisive inverted hammers on the weekly chart.
In addition, we have a very clear 55-200 week MA setup with the 55-week MA at 5,043 and a decisive weekly close below suggesting a move towards the 200-week MA presently at 3,742. It has been above the 55-week MA for over 2-years, and we have a wide gap to the 200-week MA
The pivot of the 2ndary 76.4% pullback is at 4,770-4,776 with a break below suggesting accelerated losses towards the primary 76.4% pivot at 4,288-4,290. A break below here (at least a weekly close) if seen would be a major break and suggest a danger not only of a move towards the 200-week MA but possibly much more (maybe towards 3,000)
None of these decisive breaks have yet happened here but this chart is a clear "stalker"
And as a consequence, it makes this overlay very interesting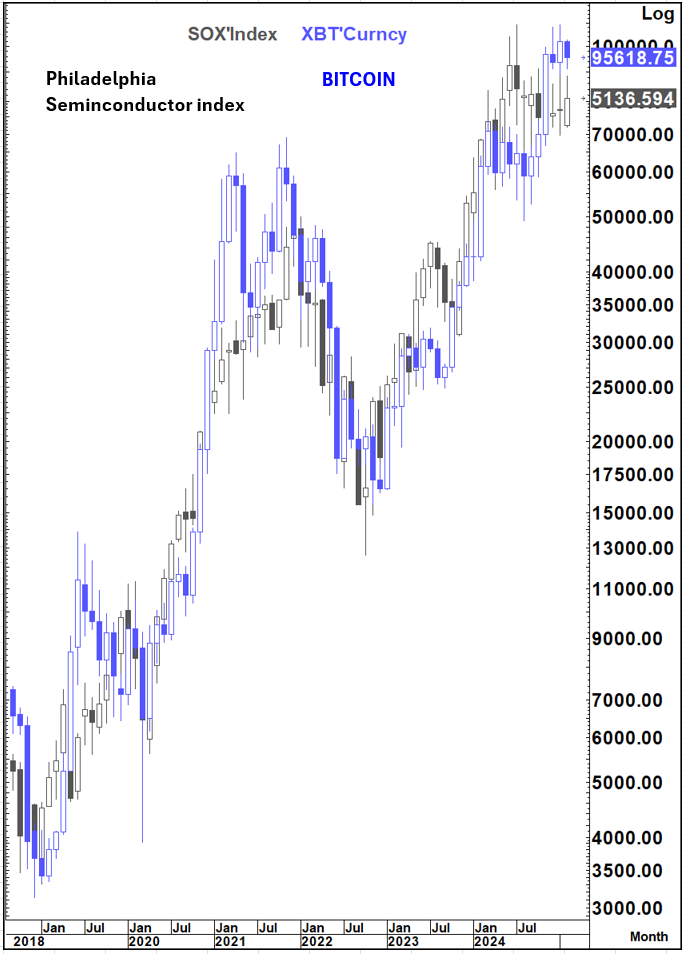
Bonus charts
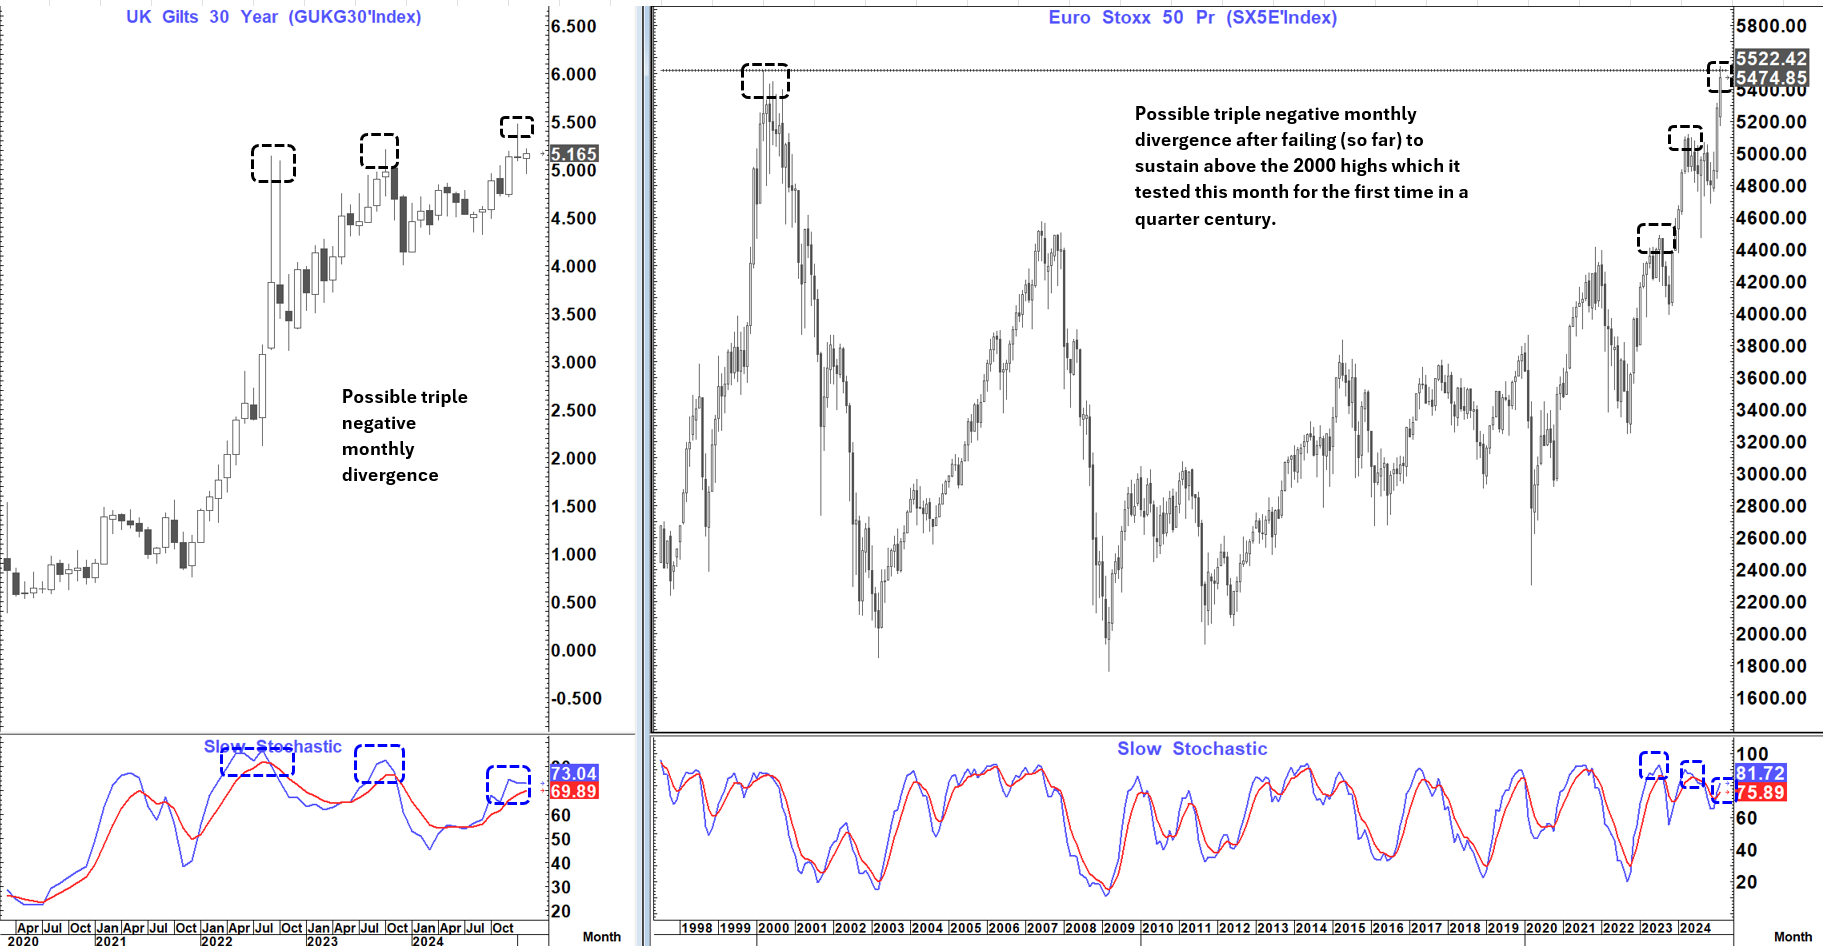
There are 2 bonus charts that I am also stalking at the moment and if the technical picture completes it would look to be a big deal.
Both the UK 30-year yield chart and the Euro Stoxx 50 equity index are IN DANGER of posting triple negative momentum divergence on their respective monthly charts. This has not happened yet as the 3rd low on momentum has not yet had a crossover (%K closing the month below %d )
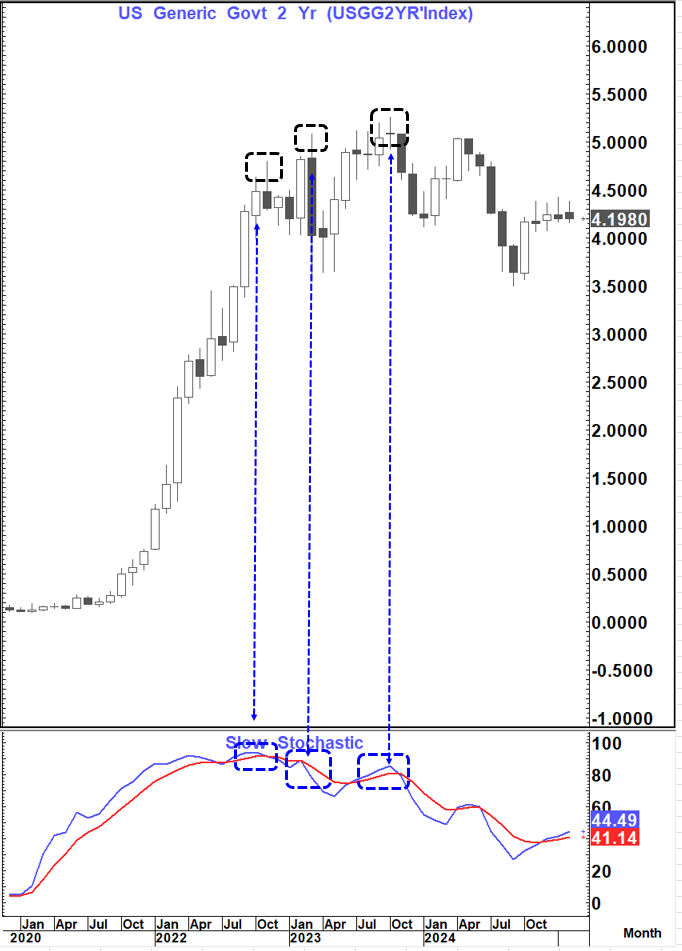
BUT...If this does happen on either or both charts it would be a development similar to what we saw on the US 2-year yield in late 2023 which signaled the trend high.
US 2-year yield turn in late 2023