
In this instance I am not referring to the Group of seven stocks that have essentially driven US Equity markets but rather the similarity in a number of charts today to 2 prior periods-
- 2017 (Trump 1.0) and seven years later in 2024.
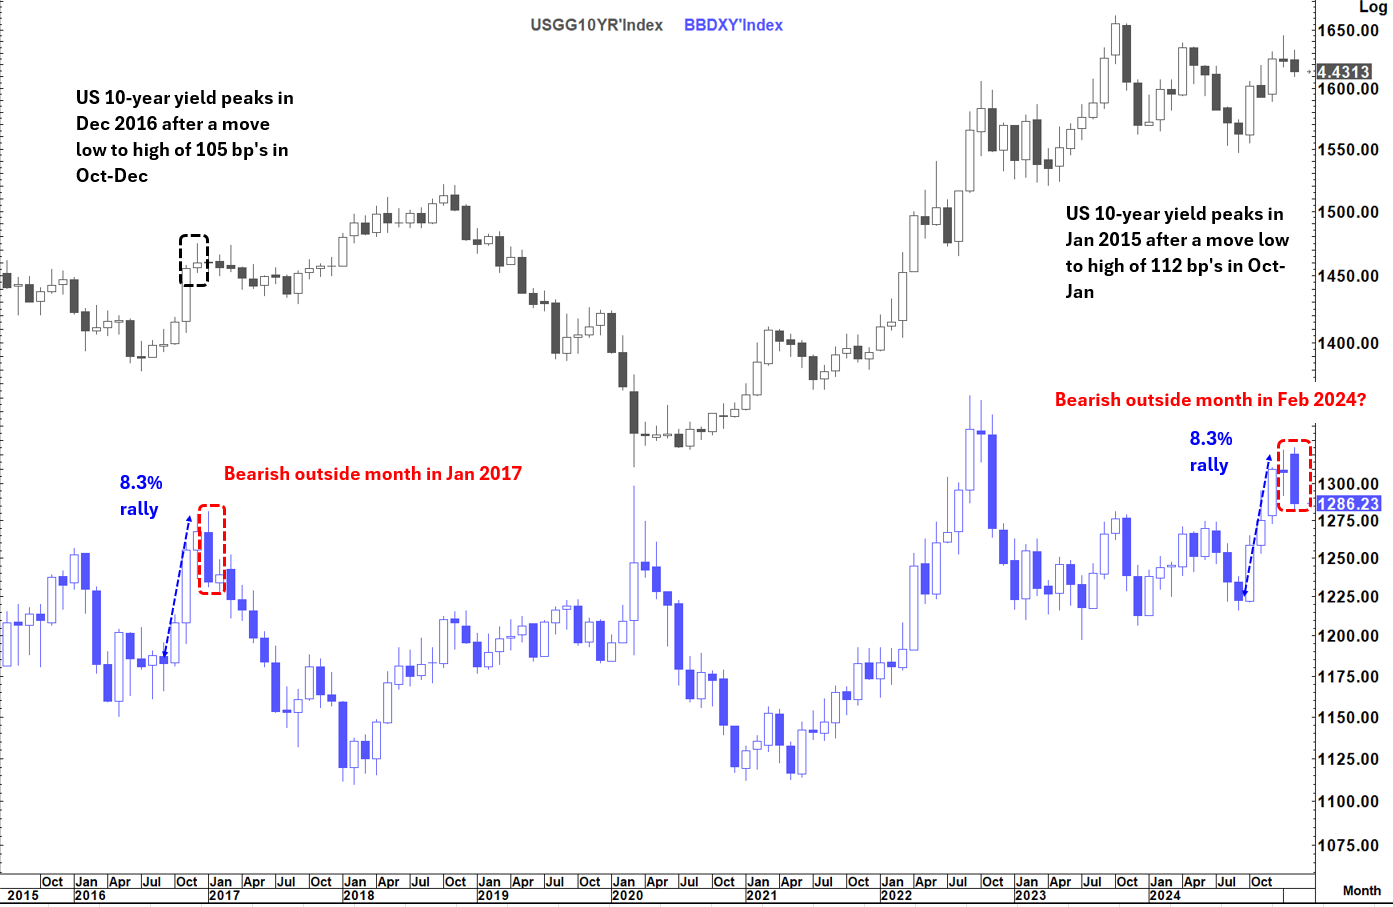
In 2017 we had of course Trump 1.0 which saw a surge in yields and the USD between Oct and Dec 2016.
The BBDXY rose 8.3% low to high in Oct-Dec 2016, then set the most marginal of higher highs in January before reversing with a bearish outside month at the trend high.
The BBDXY rose 8.3% low to high between October 2024 and Jan 2025, then set the most marginal new high in February before moving sharply lower. IF it closes this week below 1,291.87 it will be a bearish outside month at the high of the trend.
In 2017 was the start of a 9-month downtrend in the USD before any notable bounce (Sept-Oct 2017). Back in Jan 2017 we also had a bearish outside month on USDCNH, something that we will see IF we close this week below 7.2346. Other possible "outside months " are
EURUSD above 1.0533
USDCAD below 1.4261
USDMXN below 20.1343
AUDUSD above .6331
NZDUSD above .5723
Between October and December 2016, the US 10-year yield rose 105 bp's low to high before turning lower.
Between October 2024 and Jan 2025 10-year yield rose 112 low to high before turning lower.
The US 10-year yield continued lower into Sept 2017 falling 63 bp's in that period. A similar magnitude move this time would take us down to 4.18%
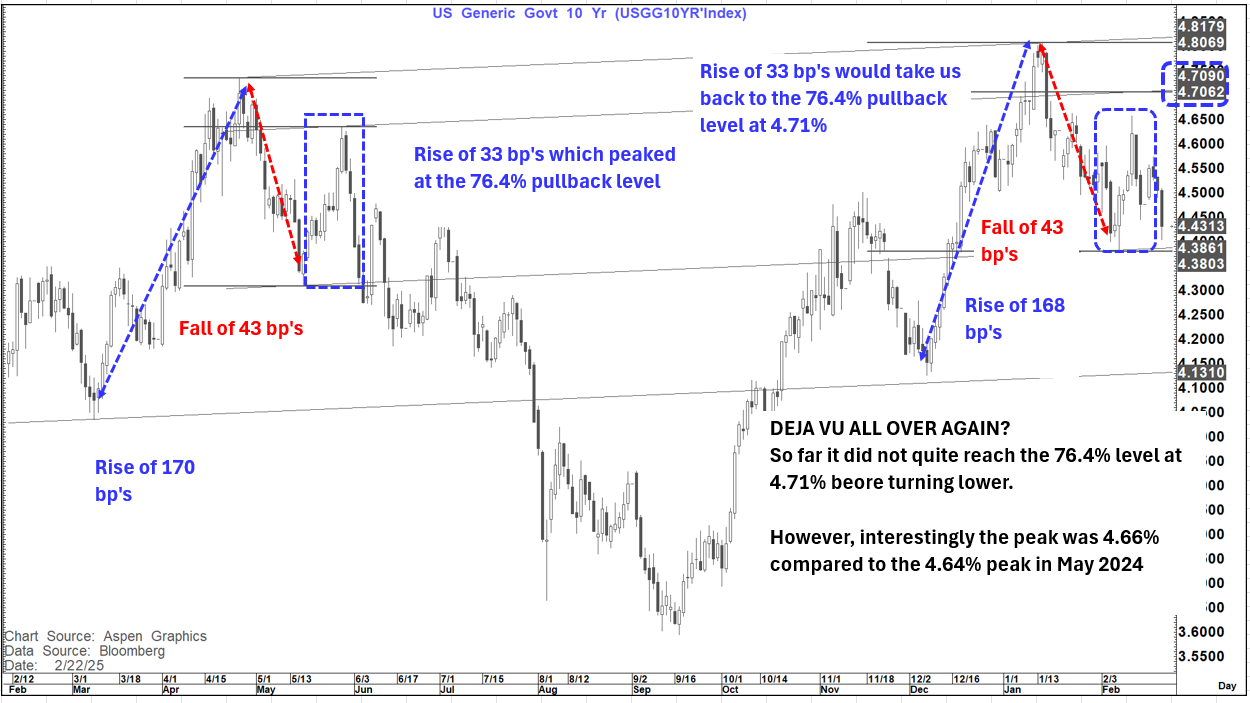
However, the pattern we see today on the US 10-year yield is actually much more like what we saw into May 2024
In that instance the move lower (high to low) was over just less than 5 months taking us 114 bp's lower from 4.74% to an eventual low of 3.60%
With the peak this time around at 4.81% a similar fall would take us towards 3.67% by June.
Split the difference and we get a sub 4% level by Q3.
It is also worth noting that as yields fell in 2024, we also saw the BBDXY fall close to 5%, USDJPY fall about 13% and USDCNH fall over 4.5%
At the start of this year, I was still on the page of higher yields over the first half of 2025 but as mentioned in pieces in recent weeks I had become increasingly short-term bullish Fixed Income while still marginally on the fence about higher yields in subsequent months.
I am off that fence and in line with recent pieces I feel strongly that the building blocks have been moving in the opposite direction (towards lower yields) . I covered this quite extensively in last week's Diary note. Diary Week 80: The Death Of Inflation
Even in the last week that conviction grew as US data continues to deteriorate quite sharply and we also had some material comments from Treasury Secretary Bessent regarding the Fed balance sheet, duration and the (non) monetisation of Gold
I now believe that longer-term rates have peaked and will head lower from here. I also believe that the "error margin" on Fed cuts this year has now moved back to a danger that we see more than is presently priced in.
Lower long-term yields are increasingly the most positive direction for:
-Consumers (mortgage rates which are still structurally higher than at any point prior to this cycle since 2000)
-The Fed who are haemorrhaging losses on their balance sheet courtesy of a portfolio yielding something close to 2% while paying 4.4% on excess reserves. The balance sheet stands at about $6.8 trillion while excess reserves are around $3.3 trillion. As of Dec 2024, the Fed's balance sheet was reported to have unrealised losses of about $800 billion. This as much as anything is why they need to soon end roll off of the balance sheet. This will allow them to re-invest at much more favourable rates and ultimately move back into profit, pay off prior losses reserved for, and ultimately start paying money to the Treasury again.
The Treasury would be a huge beneficiary here on 3 fronts.
Firstly, as detailed above they would eventually see profits flow back into their coffers as the Fed Balance sheet moved back into profit.
Secondly, they would see lower rates at which they could term-out debt (as Bessent said-once the Fed was no longer competing on the supply front.)
Third lower interest rates in general would start to reduce the interest costs that have risen above the cost of defense on the budget. In the near term lower shorter-term interest rates would also be very preferable in that regard.
The reality is that all of the above benefits would be much more valuable than whether Core PCE is at 2.5% (which it already is on a 6-month annualised basis) or 2% given that the 2% level is simply a made-up number with no overall significance.
Both 2% and 2.5% are both low inflation rates and there is no question that the 50 bp's inflation tradeoff for the benefits above is well worth it.
To sum up:
I think the US consumer is close to "tapped out" as noted in last week's piece- so even IF tariffs are put in place and potentially inflationary it is not clear this can now be passed on to the US consumer. That means companies may have to "absorb" some or all of the increase in profit margins at a time when the equity market is very "rich"
The economy is clearly slowing and will continue to do so as the "largesse" of Government excess spending is no longer there to support it.
The unemployment picture is susceptible here, firstly on the Government side and then likely on the private side as business look for ways to save costs. I would look closely next week at the Consumer Confidence "JOBS PLENTIFUL/JOBS HARD TO GET" ratio. that deteriorated notably last month and was followed by downside misses on both JOLTS and payrolls.
This supports the idea of both lower US yields and a lower US Dollar (Even without a Mar a Lago accord). This may also finally be a recipe that starts to pressure the stock market which could therefore feed further back into the economy and yields (we are not there yet but I am watching closely for signs of a turn)
All this suggests that the next 2-weeks into month end and then into payrolls will be instrumental in determining whether what the charts above suggest comes to fruition.