
What look to be the best charts across assets to watch most as we start the week?
In FX
Technically we had a huge failure in developments that would have suggested significant further USD weakness in a path similar to January 2017.
Up until recently we had the potential for a whole host of bearish USD reversals including USDCAD, NZDUSD ,AUDUSD . As we headed into last week they looked less likely but reversals (bearish USD) in the BBDXY (Bloomberg USD Index), USDCNH and EURUSD remained very much on the cards.
As risk off pervaded the market they too not only vanished but we ended up with a number of bullish USD developments.
We posted bullish outside weeks on BBDXY, DXY, USDCNH and a bearish outside week on EURUSD
This suggests that the Jan 2017 analog of a return to USD weakness has in likely failed and we will likely now see the USD head back to the 2025 highs at a minimum.
We also saw bullish outside weeks on USDSEK, USDCLP, USDZAR , USDSGD, USDKRW ,USDTHB, and USDMYR

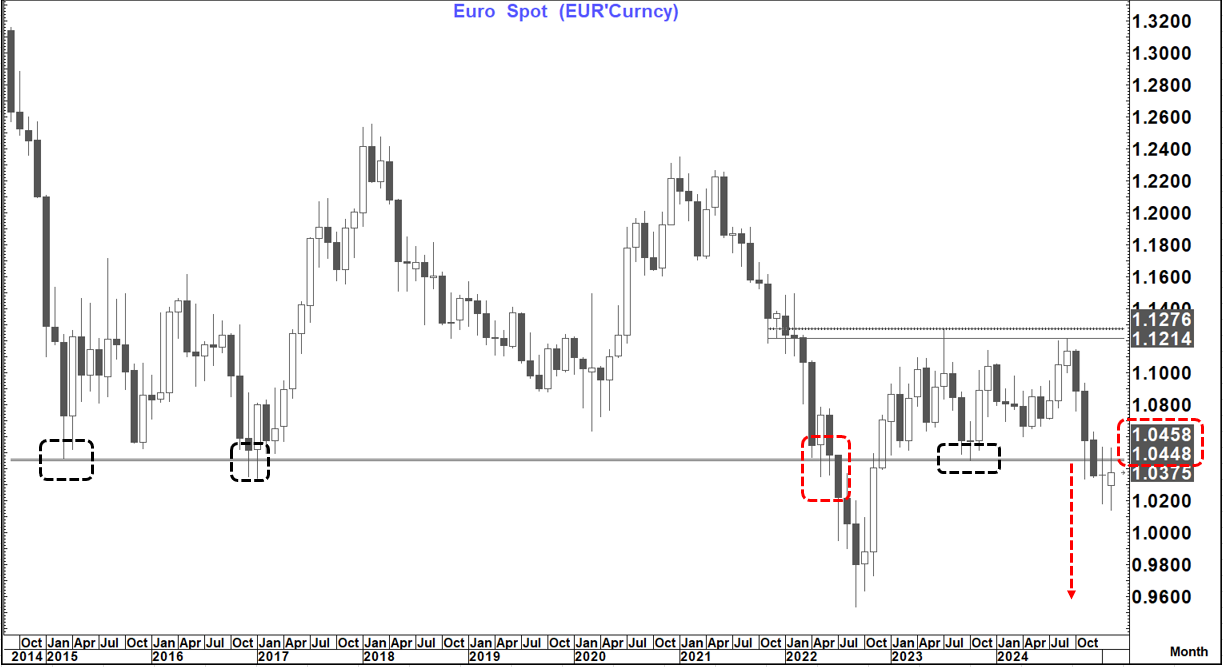
When I say at least back to the USD highs for the year it is because if you look at EURUSD for example the failure looks more significant.
The monthly reversal here, if seen, would have questioned the big break down below the 1.0448-1.0458 area seen December but failed to do so for the 2nd month in a row.
This suggests that the medium-term target on that break of .9650-.9670 remains intact. That can be a little more difficult to "square" with the view of lower US yields unless of course that is coming in a risk off World where the USD becomes a safe haven currency (admittedly 2nd to the JPY and to a certain extent the CHF.
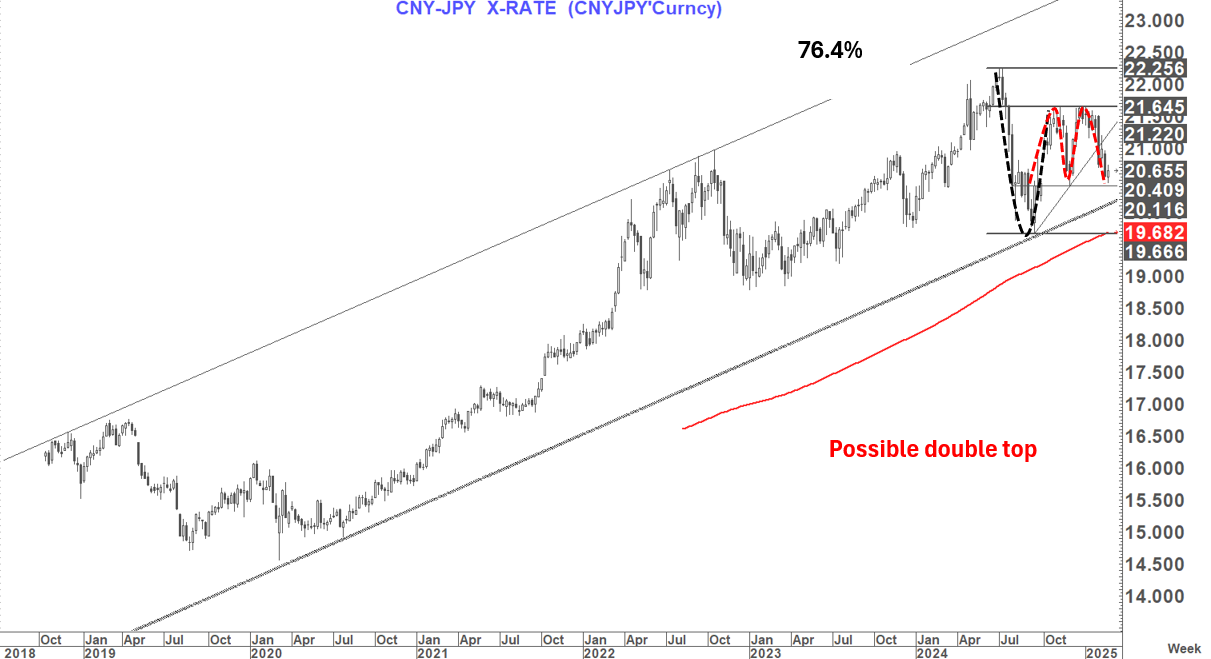
All that suggests to me that lower JPY crosses and potentially lower CHF crosses may be the best FX trades.
In G10 World EURJPY, AUDJPY, GBPJPY, EURCHF all look interesting but notably so does the CNYJPY chart.
In Fixed income
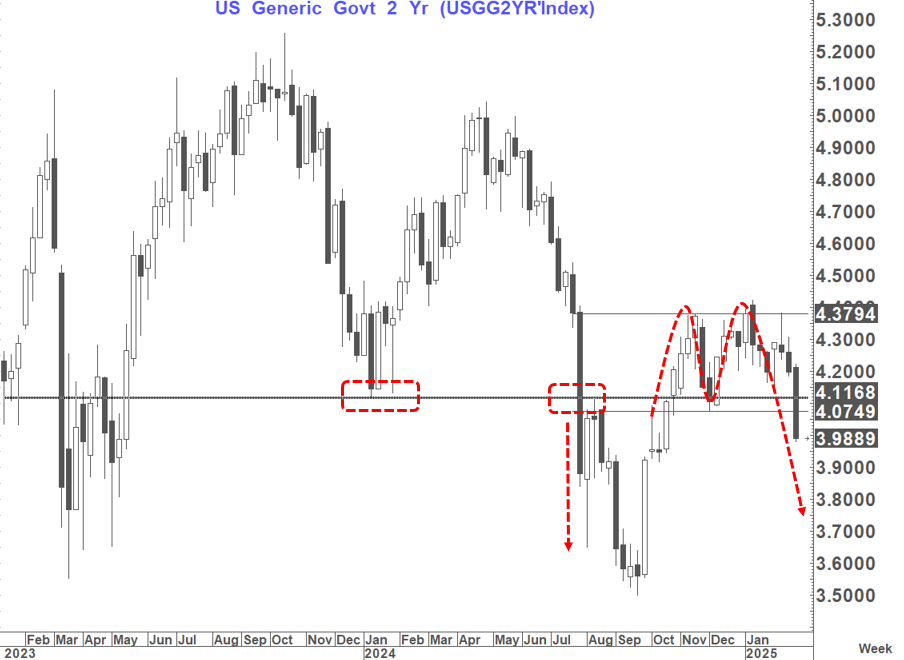
The most interesting technical development is Clearly the completed double top on a weekly close basis on the US 2-year yield as this suggests the danger of a move towards 3.75%. Such a move would likely see more aggressive pricing for a Fed ease in May (albeit not necessarily something they would capitulate to.
When we broke similar levels last July and accelerated lower the main culprit was the Equity market. This break makes the further flattening in 2's 5's mentioned in this week's diary piece Diary Week 82: The Financial Bible-Book Of Revelations a little more difficult near term but a stubborn Fed, if seen, could still facilitate this.
In Equity markets
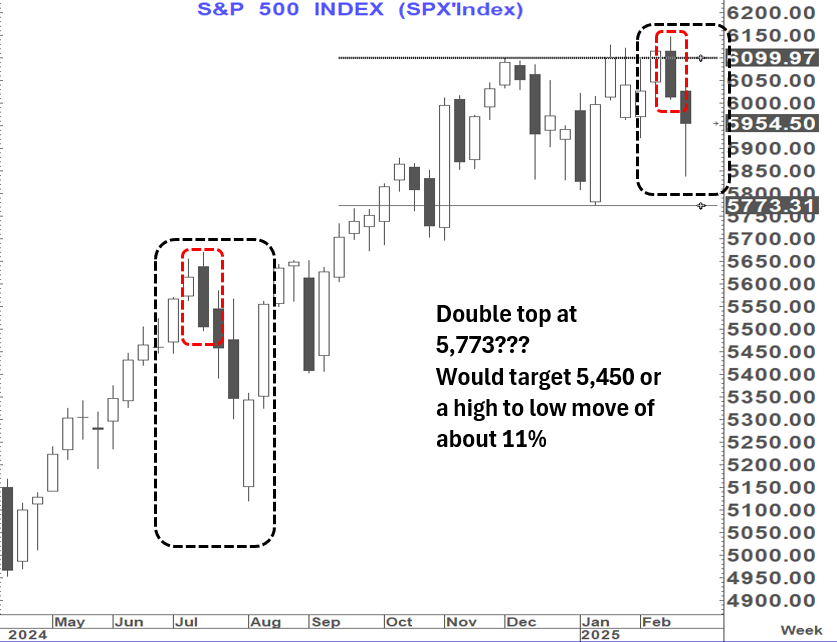
Last week looks just like the week of 22 July 2024 when the S&P was in its second week of moving lower after a bearish outside week the prior week.
We just missed a bearish outside week in the S&P two weeks ago and had our second down week in a row last week.
In those 2 weeks in July the S&P fell high to low 4.9% compared (so far) to 5 % this time before a 3-day bounce. On 31 July 2024 the S&P closed up 86 points compared to 92 points on Friday.
It then posted an aggressive bearish outside day on 01 August that led to a 3 day fall of 8% (for a high to low move of just under 10%.) and sharp falls across the curve on yields.
In addition, the SPX has completed a double top which suggests a move to at least 5,710 with a bigger double top possible below 5,773
In recent days I have been articulating that an increasingly bearish picture looks to be developing on Equities- With the SOX and the NASDAQ both looking very susceptible.
On the 5-year note (FV1) we had a closing break very similar to that seen last July, on Friday
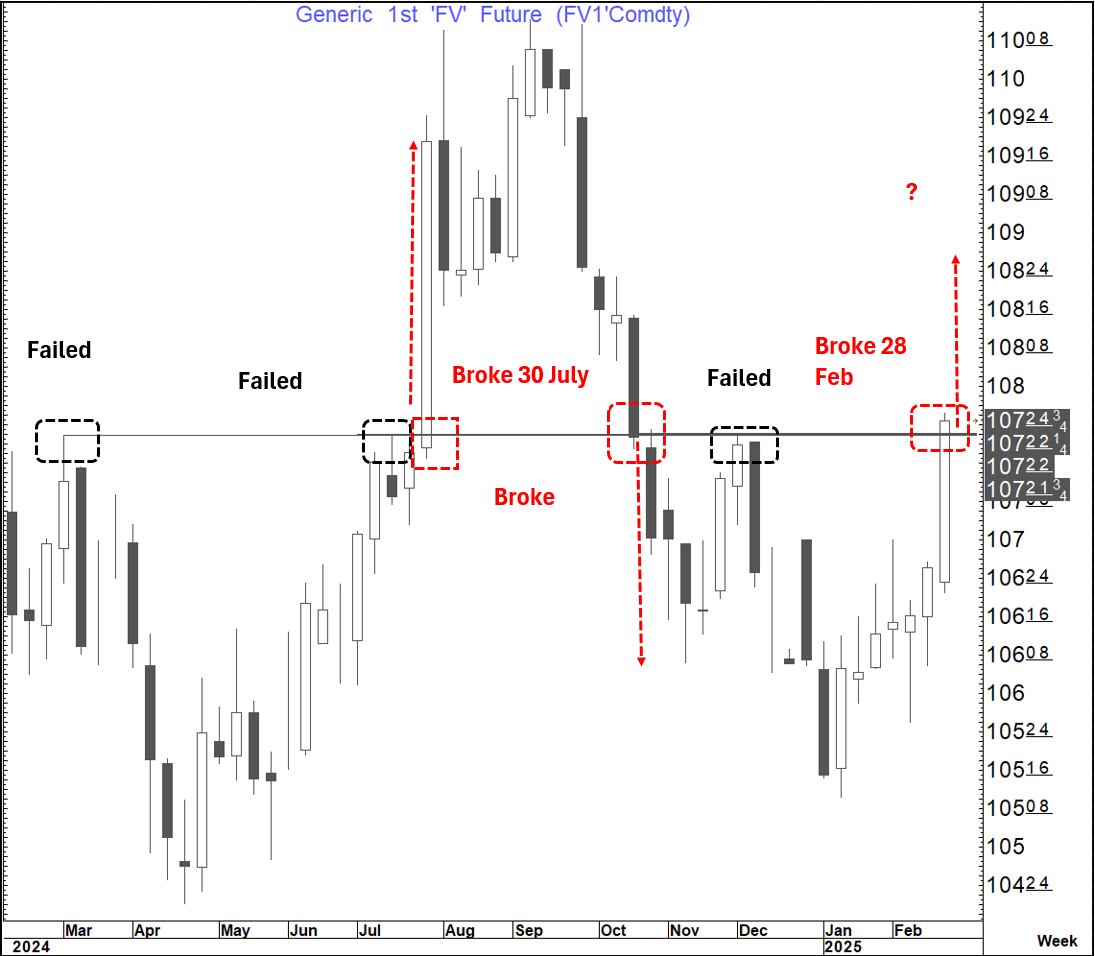
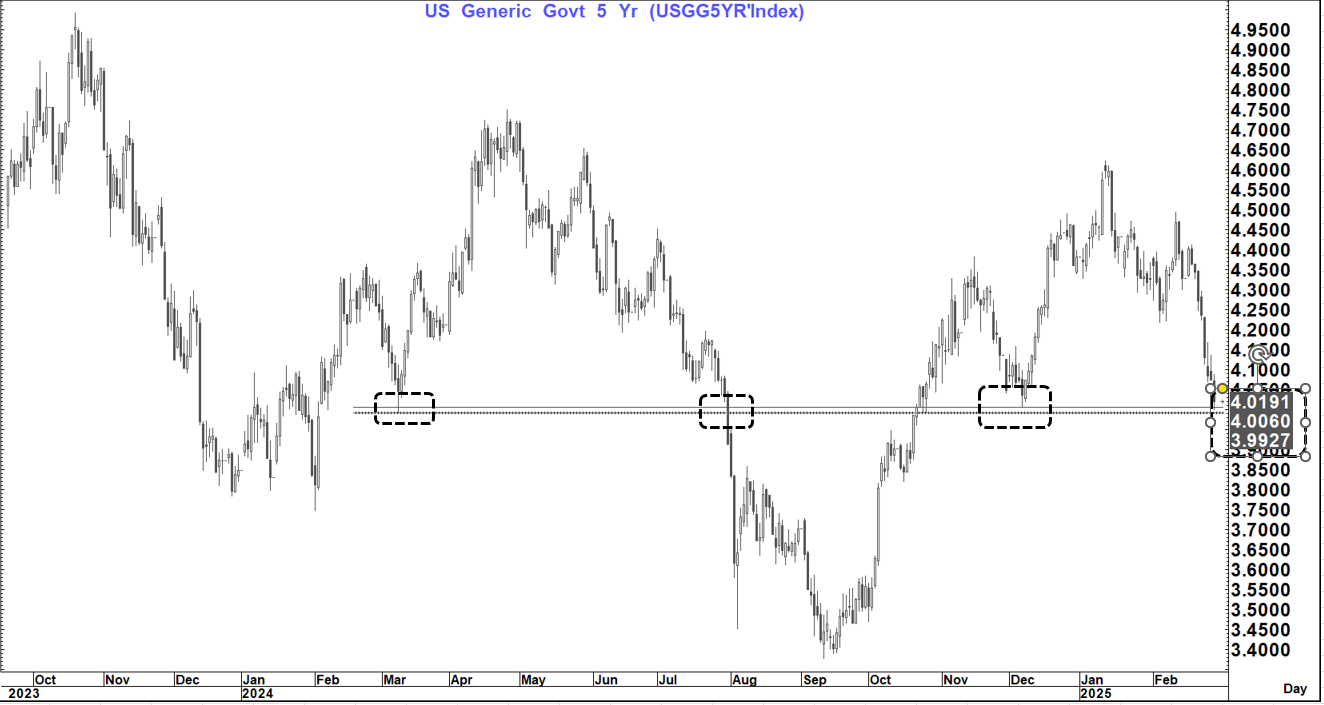
The 5-year yield chart is also testing the same pivotal area at 3.99-4.01% that broke on 31 July last year.
So, as we start the week what do I think.
Yields still look set to head lower with the break already seen on the US 2-year yield and the US 5-year yield on "the cusp"
While to date this move has been technical and on soft data it now looks like it could be further exacerbated by risk off with a picture very similar to the end of July "percolating" suggesting that equity markets could be under pressure again next week.
The other "risk asset" - Bitcoin remains under pressure as expected and the only question there seems to be is whether it is heading towards $70k or extending towards $50k or below.
On a risk off trade the USD picture becomes more complicated. As we saw last week that gave way to broad USD strength and after the bullish weeks in favour of the USD that looks likely to continue