Last week I put out a detailed piece about my Financial Bible - The US 2's 5's curve which you can read again here- IF The Shoe FITZ: Finding Religion Again- The Financial Bible
In this piece I argued why it had become very relevant again as it was for the three decades before Covid and suggested that we could see it once again invert and maybe head towards the historically pivotal minus 20 area.
However historically it has not just been the bullish turn towards minus 20 bp's that has been important but also (and potentially Moreso) when we turn off that level with a "bull steepening"
It is the bull steepening that suggests a new phase- particularly when it comes to the Fed.
What historically has been an important indicator to watch in that respect? (Again, trying to ignore the volatility of 2020 -2021.)
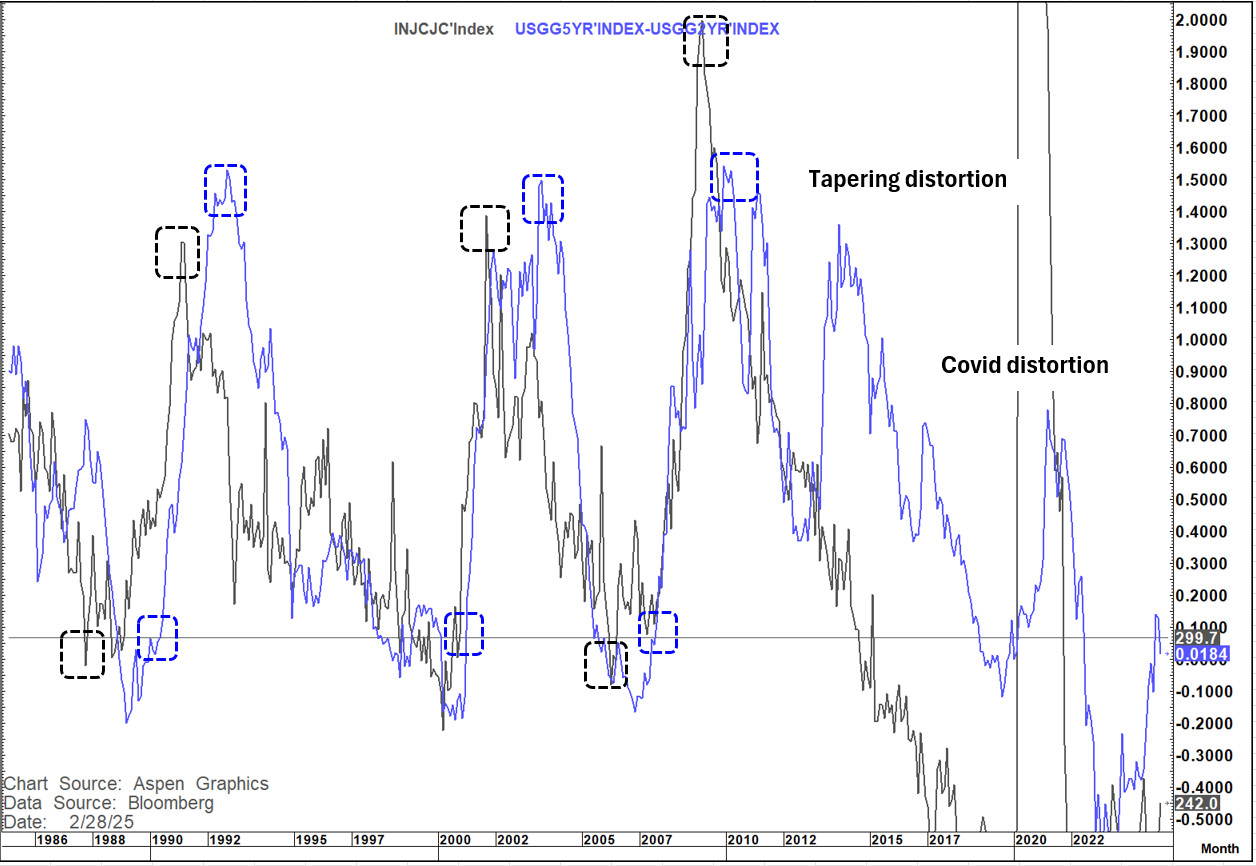
Let us look at the chart below, which again I have focused on for over 3 decades.
It is an overlay of initial claims and the 2's 5's curve.
So, at the bottom of the cycle in 1989, 2000, and 2006 (as well as the peak in 1991, 2001 and 2009 you very clearly see the relationship in turns as well as a clear relationship in the overall trend between initial claims and the 2's 5's curve.
The thing that is most notable in all instances is that it is the decisive turn in initial claims that turns the curve with a lag.
It is also worth noting that the lag at the peak is traditionally longer. Why?
At the low it means that the employment picture as defined by initial claims is deteriorating and the market anticipates as is clearly the case historically that the Fed reacts more quickly to a negative turn off the lows in employment (quick to stimulate).
When it turns off the highs, they are slower to withdraw accommodation (The employment mandate is not two sided like the inflation mandate of 2%)
This is of course in the pre-covid/Ukraine/inflation shock periods. However, as i have said in my recent pieces I think the backdrop is increasingly looking more like the pre-covid World again.
When you look more closely you see that the important development at the lows is twofold.
Firstly, it is when initial claims turn off their lows and move back over 300k- something that has yet to happen
Secondly after having bull flattened towards minus 20 to minus 25 bp's the 2's 5's curve once again regains above ZERO.
This is because at this point the market (correctly) starts to anticipate that the Fed is going to move into an easing cycle because of the softness in the labor market and the rise above ZERO on the curve as a consequence of the rise above 300k in claims is the catalyst
So that is our trigger to look at bull flattening morphing into bull steepening.
Let's look at the post 2020-2021 noise on this overlay.
Clearly the present level of claims is more consistent with a curve around minus 20 to minus 25 but of course what we had seen was a "bear steepening" because of renewed (misguided in my view) inflation concerns. As the curve bull flattens this relationship appears to be normalising.
IF initial claims keep rising in the near term that could temper the ability of the curve to reach that minus 20 level (although a stubborn Fed could still facilitate it) and if we can see a move back above 260k on initial claims would look to be a breakout (double bottom) that would suggest levels around 330k. That would be more consistent with the curve regaining /sustaining above ZERO
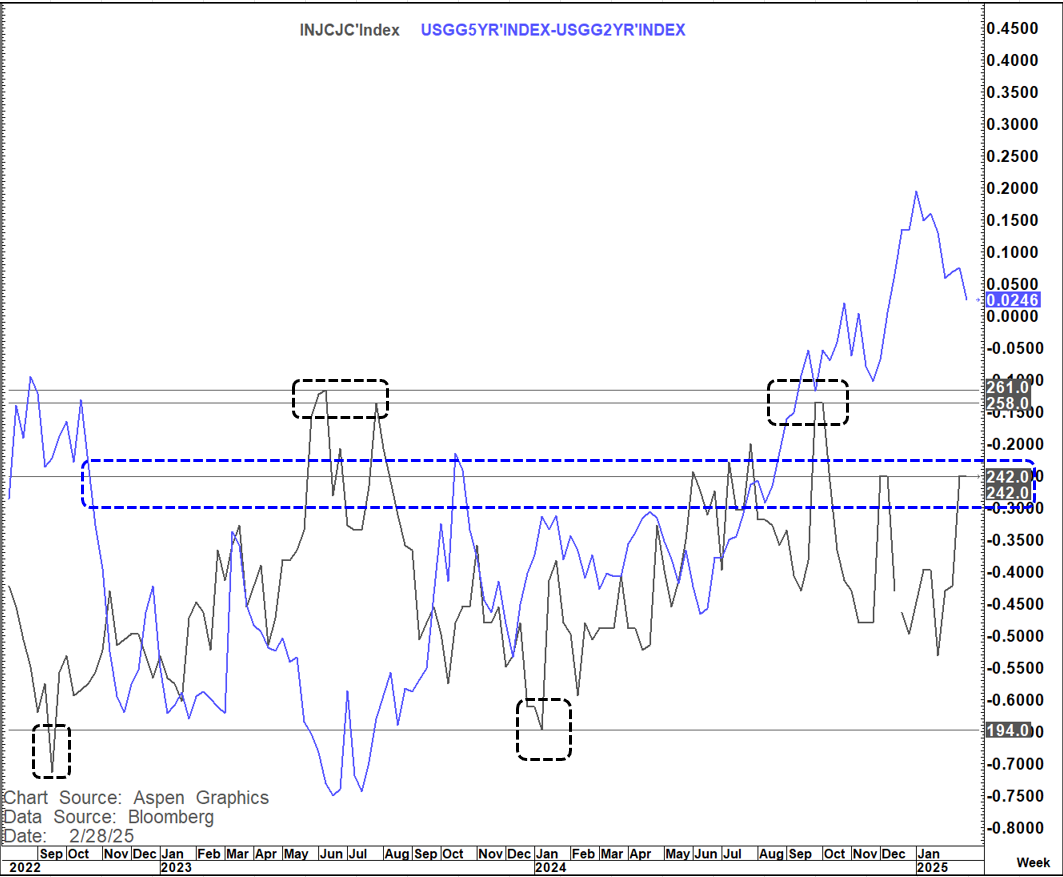
I think this relationship is re-asserting itself and needs to be watched closely in the coming weeks for guidance on curve direction, yield direction, and ultimately fed direction