
I have long talked about the US 2's 5's curve being my "Financial bible in terms of curve direction, rate direction and ultimately Fed direction. However, in recent months I have not had much to say on it in terms of what it is doing and what it means overall.
So today I thought I would deliver some thoughts ...starting first with a little history because this chart is back and maybe back with a vengeance.
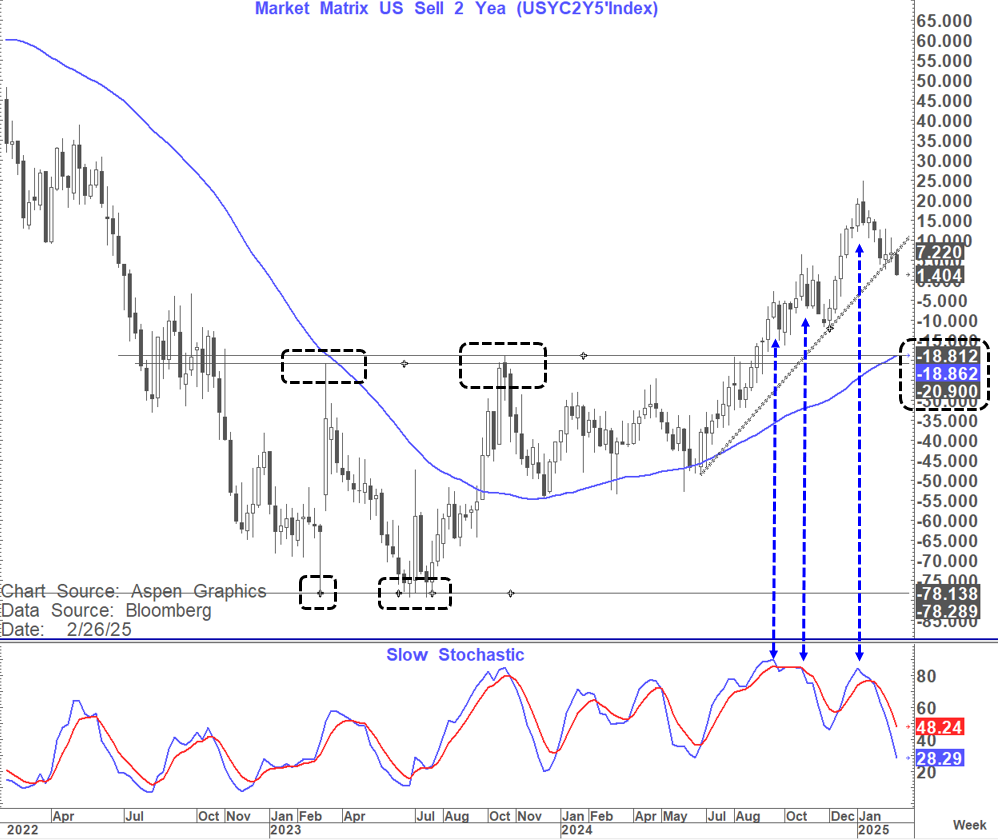
Back in 2024 we finally completed a very well-defined double bottom as we broke back above the minus 21 to minus 19 area.
That targeted a move as high as + 36 basis points and from Sept-January we just headed inexorably higher in line with the move up in the 5-year yield (Bear steepening) as the "pause" message from the Fed started to resonate louder and louder.
Despite this, we did not manage to get to our +36 bp's target and since mid-January have been heading lower again as a "bull flattener". In fact at the peak, we got one of my favourite indicators - Triple momentum divergence on the weekly chart.
Now this week we are breaking the uptrend in place since June last year.
We now look like we are inevitably heading negative again (very close as I am writing this) to at least minus 10 to minus 12 and possibly back to minus 19 to minus 21 again where horizontal supports and the 55-week MA converge.
Whether it goes to minus 10 or minus 20 could be important. Why?
Time to look at the long-term history here.
The move lower to minus 79 bp's was unprecedented in recent history.
In fact, you have to go back to 1979-1980 to see such a deep inversion (and more) as the Fed raised rates first to 10% and then to an incredible 20% in what had been until then a "losing battle" against inflation.
But outside that period the picture is very different.
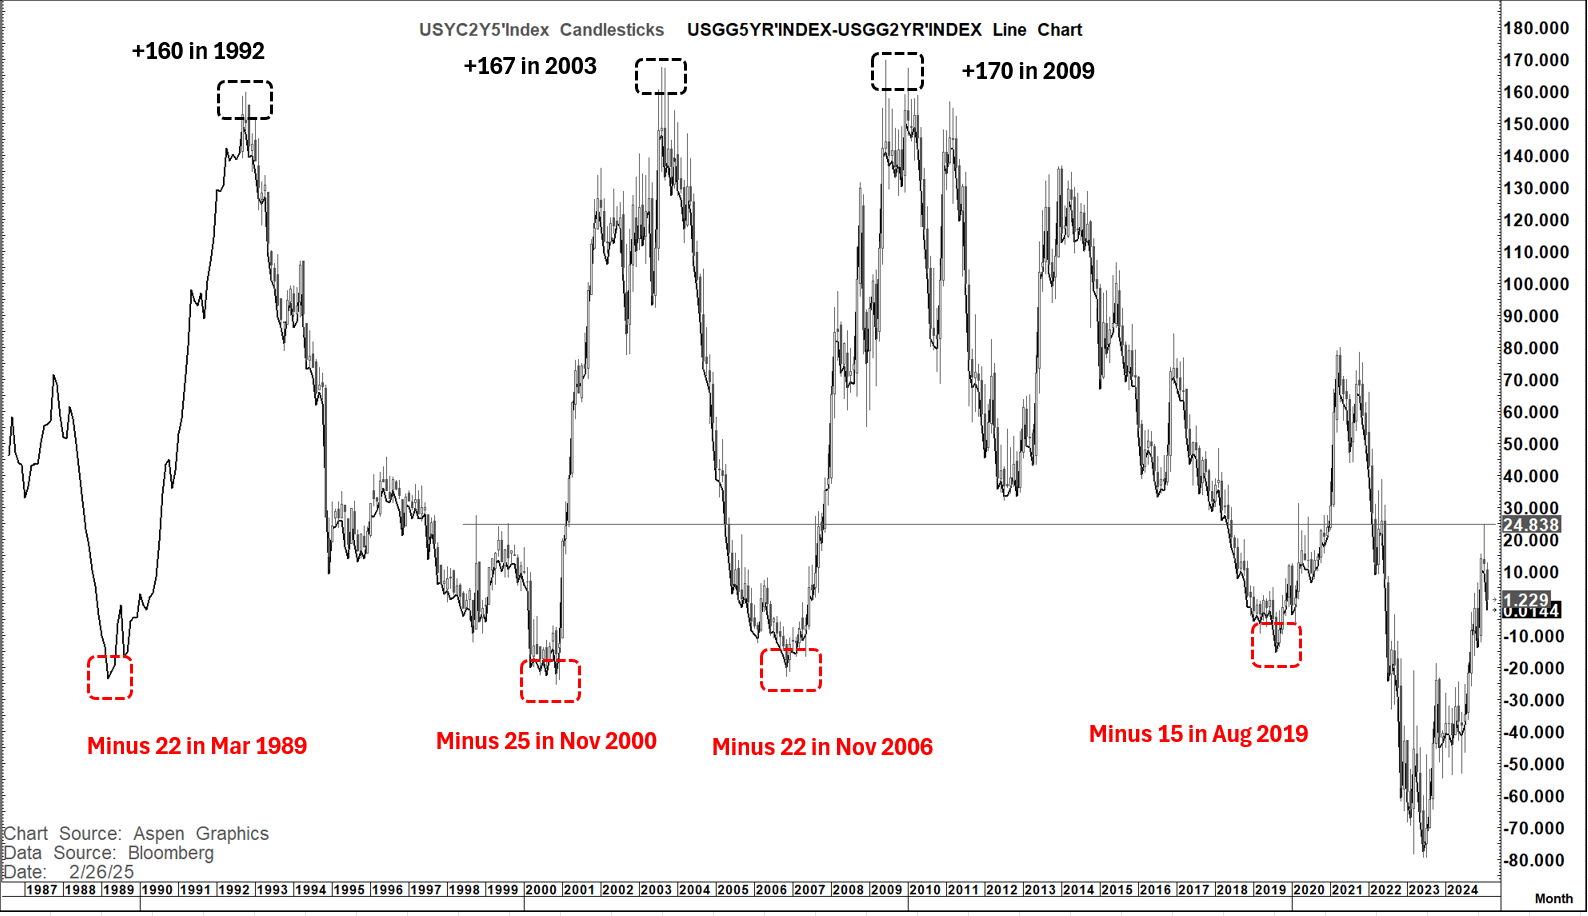
The chart below is the reason I have been very focused on this curve for the last 30-years. Outside of the recent inflation cycle this has by far been the most symmetrical curve out there going back 35 to 40 years.
Prior to this inflation cycle (the most aggressive since the 70's but nothing like the 70's) every major high has been in a +160 to +170 bp range and every major low in a minus 15 to minus 25 bp range. The minus 15 was an exception but I will return to that.
Right now, this curve looks like it can bullishly invert back towards minus 10 to minus 12 bp's but very possibly towards minus 19 to minus 21 bp's
So next we go into a leap of faith (what else would you do with a financial BIBLE)
In recent weeks I have been vocal about believing that the scenario had changed such that we were moving into a backdrop more like the World pre covid, pre–Ukraine War, pre middle east conflict (all supply driven inflation catalysts).
So, if I am correct (big ask I know) then it should not be a leap of (too much) faith to think that this curve may go back to trending like it used to with all the guidance that comes from that.
Over this 35-to-40-year period this curve inverted minus 20 to minus 25 bp's on 3 occasions
1989- At the start of the banking/housing crisis and deep recession when it inverted 22 bp's. The Fed very quickly began an easing cycle (June) that ultimately took us from 9.75% to 3%
2000- As we headed into the endgame in the DotCom bubble it inverted 25 bp's in November and the Fed began an aggressive easing cycle in January that took us from 6.5% to 1%.
2006: As we headed into the greatest housing/banking and economic crisis since 1929 it inverted 22 bp's in November. But it was different this time (yeah right).
This time it was not that the curve "bull inverting" was a warning sign of bad things to come it was because everybody loved our "yield" so much they were buying our treasuries, The Fed actually said that (and also told us that housing was contained)
Watch how when we invert this time we are similarly told (probably by the Fed again) that it is not a sign of concern.
Well, as a consequence the Fed waited 10 months after this inversion before the first cut in rates and that ended really well as they got caught massively behind the curve. The main reason for the wait was that Ben Bernanke was more concerned about a resurgence in inflation and the danger of needing to raise rates.
2019: This was a little different and a clear example of what drives Fed policy at any given point- their last mistake. In 2019 they recognised that they were both too slow to ease and then too quick to withdraw accommodation during the GFC leading to a long and slow jobless recovery. They vowed that in the next crisis (who knew that it was just around the corner) that they would :
Plan A: Be much more aggressive in front loading easing
Plan B: Be much slower it withdrawing that easing until they were sure it was "all clear"
Well, that guided them into their next policy mistake.
I am not referring to when they eased in in July 2019 and again in September and November even though the yield curve had not inverted 20 bp's. (It inverted to only minus 15 bp's in August but they "pre-empted" the minus 20).
That made perfect sense on the basis of history and also their most recent experience.
I am also not referring to the fact that they delivered "Shock and Awe" (Plan A) in March 2020 as Covid hit in earnest.
I am referring to that fact that Plan A worked spectacularly well (Stock market turned aggressively, Economy turned aggressively, Employment improved aggressively, massive stimulus put money in people's pockets and the savings rate soared, cheap mortgages were abundant etc). however, we kept rates at ZERO until March 2022 and continued to expand the balance sheet in that period.
Plan B should only have been implemented if Plan A was not effective. Then we released the whole Nation from Covid jail with their pockets stuffed with money, jobs abundant, the stock market soaring. Animal spirits took over and the resulting inflation soared (what a shock- really)
So of course, as a consequence of this, today's policy is then driven by the last mistake and the fear that they make the same mistake twice in a row.
Let's get serious. in the overall scheme of things, it does not matter whether inflation is 2% or 2.5% (Core PCE- which is already at 2.5% 6-month annualised rate) and as I noted in my earlier piece today and recent weekend pieces, I think the building blocks we see are increasingly disinflationary at a time when real yields are high and mortgage rates stratospheric with a very low savings rate again.
But the Fed are still worried about the last mistake and will be reluctant to come back to the table unless their employment mandate deteriorates.
So, IF we see this 2's 5's curve bullishly invert back towards 20 bp's negative like in 1989,2000 and 2006 what does it mean?
IF I am right (again a big IF) that we are back in a more Pre Covid/Ukraine war/Middle east conflict world then such a bullish inversion is a warning sign.
Initially at least the Fed will dismiss it (as will probably a lot of the market) unless they are seeing clear signs of an employment deterioration.
At close to minus 20 bp's the warning bells will need to ring loud (in my opinion) that something different is clearly going on and that the Fed is (once again) fighting yesterday's battle.
Which of the 4 periods above resonates most at the moment
1989? No. At this point there are no signs of any material banking or housing stress.
2006? No. We have no obvious mortgage crisis or financial stress that resonates.
2019? No. That was a tail risk era both in terms of Covid and the Ukraine war. You always have to be cognizant of tail risk potential, but it is just that a tail risk so hard to see coming.
2000? MMMMMM!!!! Global easing in 1998 due to a contagion- but that time a financial contagion. We had the Asia crisis, LTCM, The Russian financial crisis and some stress in Mexico.
As it settled down the Fed returned to raising rates between June 1999 and May 2000 (this time March 2022 to July 2023)
They then paused for seven months before easing in Jan 2001. This time we stayed out for 13 months until Sept 2024.
After 100 bp's of cuts they paused between January and March before the rate cuts resumed. We have been on pause since December after 100 bp's of cuts.
In December 2000 the unemployment rate was 3.9% (now 4%) just 1/10th off the trend low (Now 6/10ths)
After inverting in Sept 1998 (just to minus 12 bp's) the 2's 5's curve steepened again and hit +25 bp's in August in 1999. This time we hit +25 bp's in January this year and are now almost flat again.
In the prior period we went to flat by Feb 2000 with the DJIA peaking in Jan 2000 and the S&P in March before falling 14% over 4 weeks.
Between 02 March and 07 April 2000 the 2's 5's curve went from a high of +10 to a low of minus 20 and then the S&P collapsed more than12% over 5 trading days as the market got "spooked"
Since 12 Feb this year we have seen this curve move from + 12 bp's to +1 - dangerously close to inverting
Back then while the curve did stabilise before finally hitting its lowest level in November at minus 25 bp's the die was cast.
The equity markets never regained their Jan-March 2000 peaks and that was the start of a significant bear market. Without 9/11 it may never have gone as low as it did but by the end of 2000 the NDX had fallen 55%, and the S&P 19% from their peaks.
Today, as I have articulated many times it is the SOX (Philadelphia Semiconductor index) that looks most susceptible but the NASDAQ and S&P are also starting to look vulnerable
Conclusion?
The Financial Bible is back, and it is on Code Orange.
It is not yet on Code Red but if it inverts decisively (which I think it will) as a bull inversion and in particular if it heads back towards minus 20 again then ignore it (as the fed inevitably will) at your peril.