***Early warning sign. This piece is long on pontification**
Well, the momentous day has come and gone, and we finally got the August Employment report. The single thing that strikes me so clearly is the level of the "State Of Denial" that exists.
I don't just mean at the Fed and that is clear to see from the subsequent comments post payrolls.
In addition to this, numerous market commentators seemed to find a way of putting a "Positive Gloss" on yesterday's numbers.
There was nothing good in yesterday's numbers except for the fact that they sealed the already strong perception that once again the Fed is coming late to the party long after the punchbowl has been emptied. I covered some of the thoughts in that respect with Friday's piece titled Under The Surface
It remains clear to me that the Fed panicked in Q1, when the seasonally distorted inflation numbers combined with one off factors in car insurance and elevated shelter costs (which are a direct result of the Fed's Higher for Wronger policy) led them to pull back from the intended ease.
Now, as those fears have been totally debunked as to be honest has the "strength" in NFP (Both on the basis of the annual revisions as well as the clear weakness seen in the last 3-months) board members continue to prevaricate.
Once again, they are reluctant to stop fighting the last battle and start fighting the true one, which is a deteriorating employment picture and a slowing economy.
As an aside it is also worth noting that the BDR adjustment, possibly the main culprit for the 12-month revisions on NFP) last month was +100k which is the 2nd lowest August adjustment in the last decade (lights going on at the BLS?) beaten only by the 93k number posted in August 2019 (The Fed lowered rates on 28 August 2019- (This was with an unemployment rate at 3.6% and a participation rate of 63.1% compared to 4.2% and 62.7% now). ]
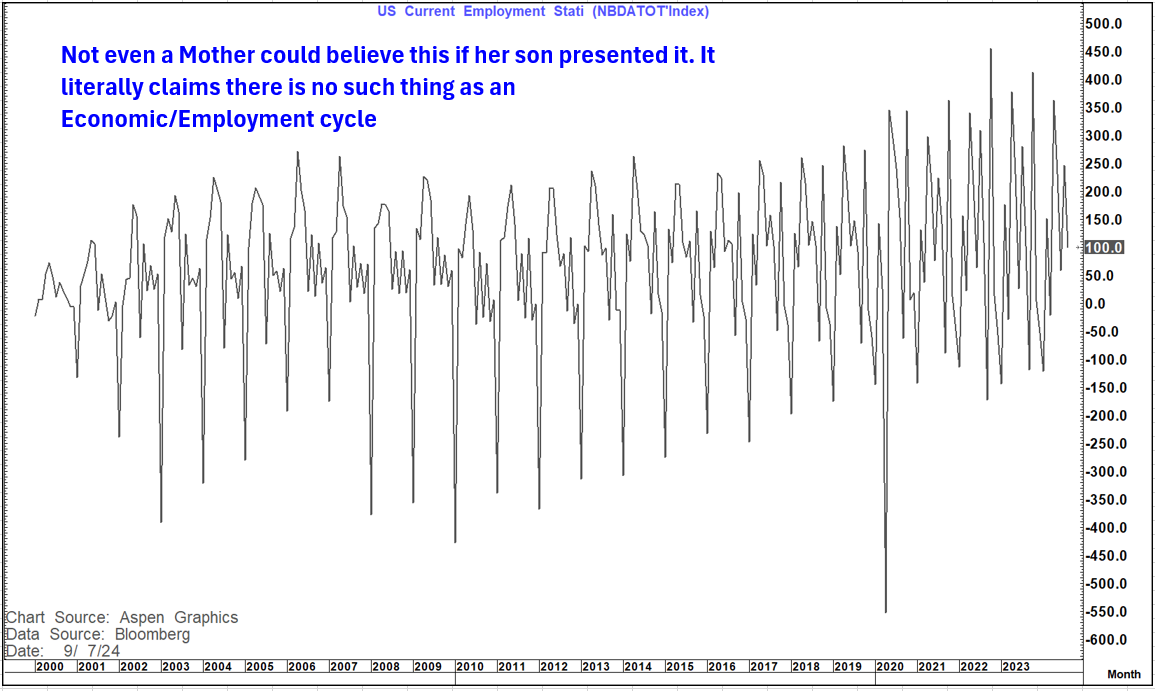
This can also make September interesting as the "adjustment" to the "Wallpaper pattern" will be negative. Why?
Because it is a wallpaper pattern with no credibility whatsoever. Just look at the picture below.
Apparently regular as clockwork for the last decade it says that we see net jobs lost on this measure in September -every single year.
But back to the Fed and where it stands. There was demonstrated reluctance to show commitment to a 50 bp September move yesterday albeit Chris Waller did suggest he was open to bigger moves than 25 bp's if needed on the basis of future information. He suggested that they needed to see the "Whites Of The Eyes" of new data before that path would materialise.
How has that worked out previously? Does the Fed not believe its own press?
They constantly tell you that monetary policy acts with a lag with that effect being up to an 18-month timeframe. So, what that means is that as soon as you are certain of the deterioration you act, and you should expect that action to take effect in about a year and a half.
Seriously- That is about as perfect a definition of "behind the Curve" as you can get.
We know that inflation has fallen precipitously.
We know that some of the sticky components left are more supply driven.
We know that nominal growth has collapsed.
We know that using NFP numbers to justify your position on the dual mandate has been exposed as an "Emperor with no clothes"
We know that unemployment is up 0.8 from the low despite a low participation rate (and BTW the unemployment rate did not fall from 4.3% to 4.2% , it fell from 4.25% to 4.22%).
We know that Underemployment has risen sharply and that we are losing full-time jobs while gaining part-time jobs.
We know that JOBS plentiful are falling and JOBS Hard to get are rising (in a pattern very similar to 2000)
We know that JOLTS are collapsing and that the JOLTS/Unemployed ratio is back to 1.07.
We know that the Quits rate is back to pre-pandemic levels.
And yet we continue to "dither" in a "Nero Fiddling As Rome Burns" fashion.
Two of my favourite charts sum this up in my opinion and show clearly that this will likely not end well.
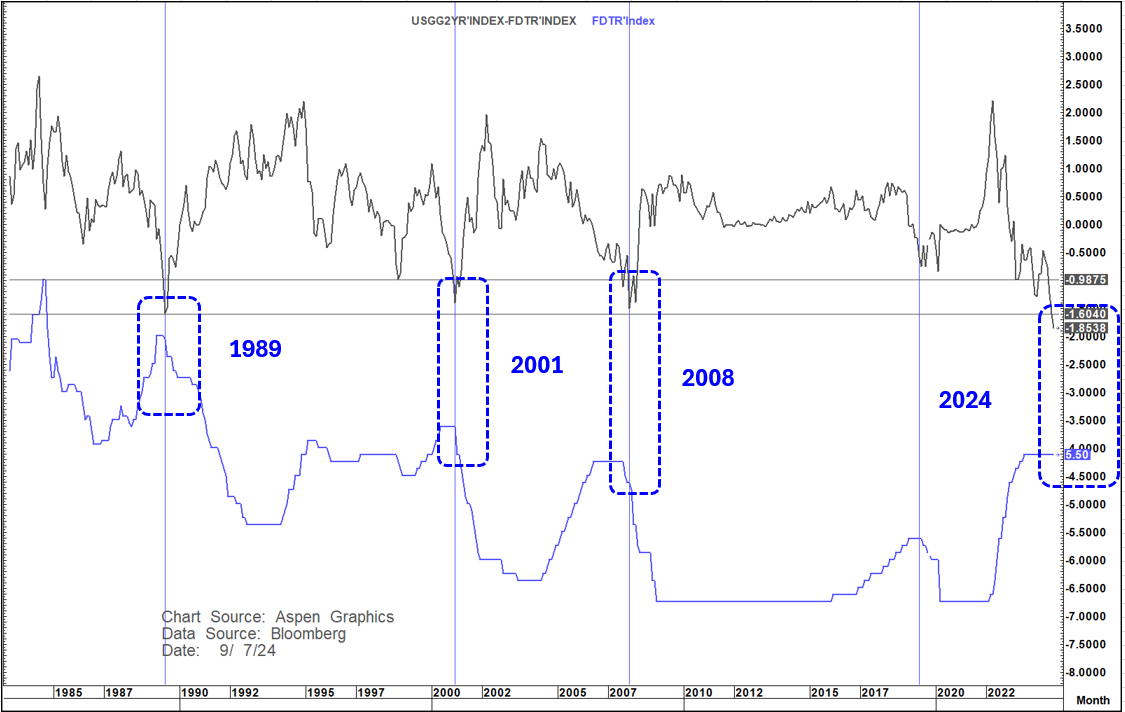
Fed Funds rate minus the 2-year yield.
In the last 40+ years the 2-year yield always diverges sharply to the Fed funds rate before a new Fed monetary cycle as the market already anticipates the next cycle. This is true for both tightening and easing cycles. With regard to an easing cycle the alarm bell has rung loudly historically if the Fed lets that inversion go too far ahead of the first ease.
I have written constantly in recent months about my 3 favourite "analogs" to today. They are 1990, 2000 and 2007. These are periods which "Rhyme" a lot in various ways to what we are seeing today.
It is interesting to look at those periods and see what happened.
In 1989-1991 the first ease by the Fed came on 05 June 1989. The Fed Funds rate minus 2-year yield had inverted to minus 127 bp's by 02 June. the Fed was very cautious in only cutting 1 8/th of a percent in the first cut. By 05 July that inversion had deepened to 167 bp's and the Fed embarked on a more aggressive and deeper easing cycle. But they were behind the curve and by Sept 1992 (3 years and 3 months later) they had ended up cutting rates from 9.75% to 3%. (675 bp's)The low in that cycle for the 2-year yield was 3.66%. 1990 is a very clear 3rd choice in these 3 analogs compared to today with 2000 and 2007 have much more similarities.
In 2000-2002 the first ease by the Fed was on 03 Jan 2001. Despite high real yields (400 bp's), a deteriorating employment picture and an Equity market that started to shake the Fed remained unmoved in the 2000 election year not cutting until Jan 2001. The first cut was 50 bp's as were the next 4 into May 2021. On 02 Jan 2001 the Fed Funds rate minus 2-year yield had inverted to minus 164 bp's. The Fed was very late to the game, cut aggressively from the get-go, cut 250 bp's between Jan and May 2001 and ultimately cut 550 bp's in that cycle to 1% by June 2003 (2 years and 5 months later). The low in the 2-year yield in that cycle was 1.08% in June 2003.
In 2006-2008 the first ease by the Fed came on 18th Sept 2007 and was 50 bp's. On the 10th of Sept 2007 the Fed Funds rate minus 2-year yield hit minus 140 bp's but despite the 50 bp's cut the Fed was once again behind the curve. The two subsequent 25 bp's cuts before the end of 2007 did not work and the Fed Funds minus 2-year yield went to minus 169 bp's on 11 Jan, 2008 and even further to minus 190 bp's by 18 Jan 2008. On 22 Jan 2008 the Fed (now massively behind the curve) cut rates by 75 bp's and in this cycle into 2009 and ZIRP and QE were "born". The low in the 2-year yield in this cycle was 60 bp's in Dec 2008. The easing cycle into December 2008 (15 months later) was 525 bp's
There are 4 important takeaways from this chart.
1. The Fed gets caught behind the curve constantly but when that yields an inversion of 160 bp's or more in the 2-year yield to the Fed funds rate the "goose is cooked" and bad things happen forcing an aggressive catch-up mentality. They recognized this in their announced change of focus in 2019 vowing to be more pre-emptive and exercised that caution in July 2019 by cutting rates when the deepest inversion seen here had been 77 bp's in late June and 65 bp's the day before they cut.
2.Where is that inversion today? If we use the upper bound of the Fed Funds rate at 5.5% (the first of these cycles where it is a range) the number is a catastrophic 185 bp's . If we instead use the mid of the fed Funds range at 5.38% then the number is an awful 173 bp's .
3. Wherever the cycle low is on the 2-year yield the ultimate terminal rate for the fed will likely be at least as low if not lower. so far that low is 3.59% but the long-term charts suggest that sub 3% could be on the cards here.
4. whatever way you look at this, it suggests that the Fed has (once again) got caught napping and will be forced to take a much more proactive stance. History also suggests that the clock is ticking and the longer they wait to be forceful the worse it will likely get and the more forceful they will have to be.
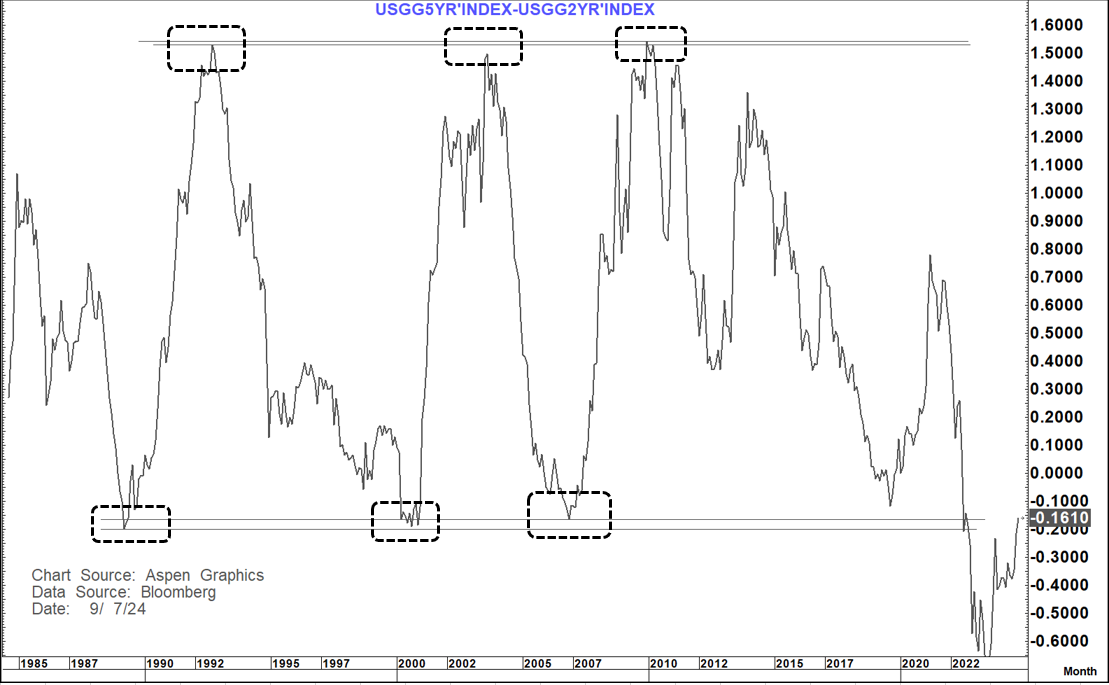
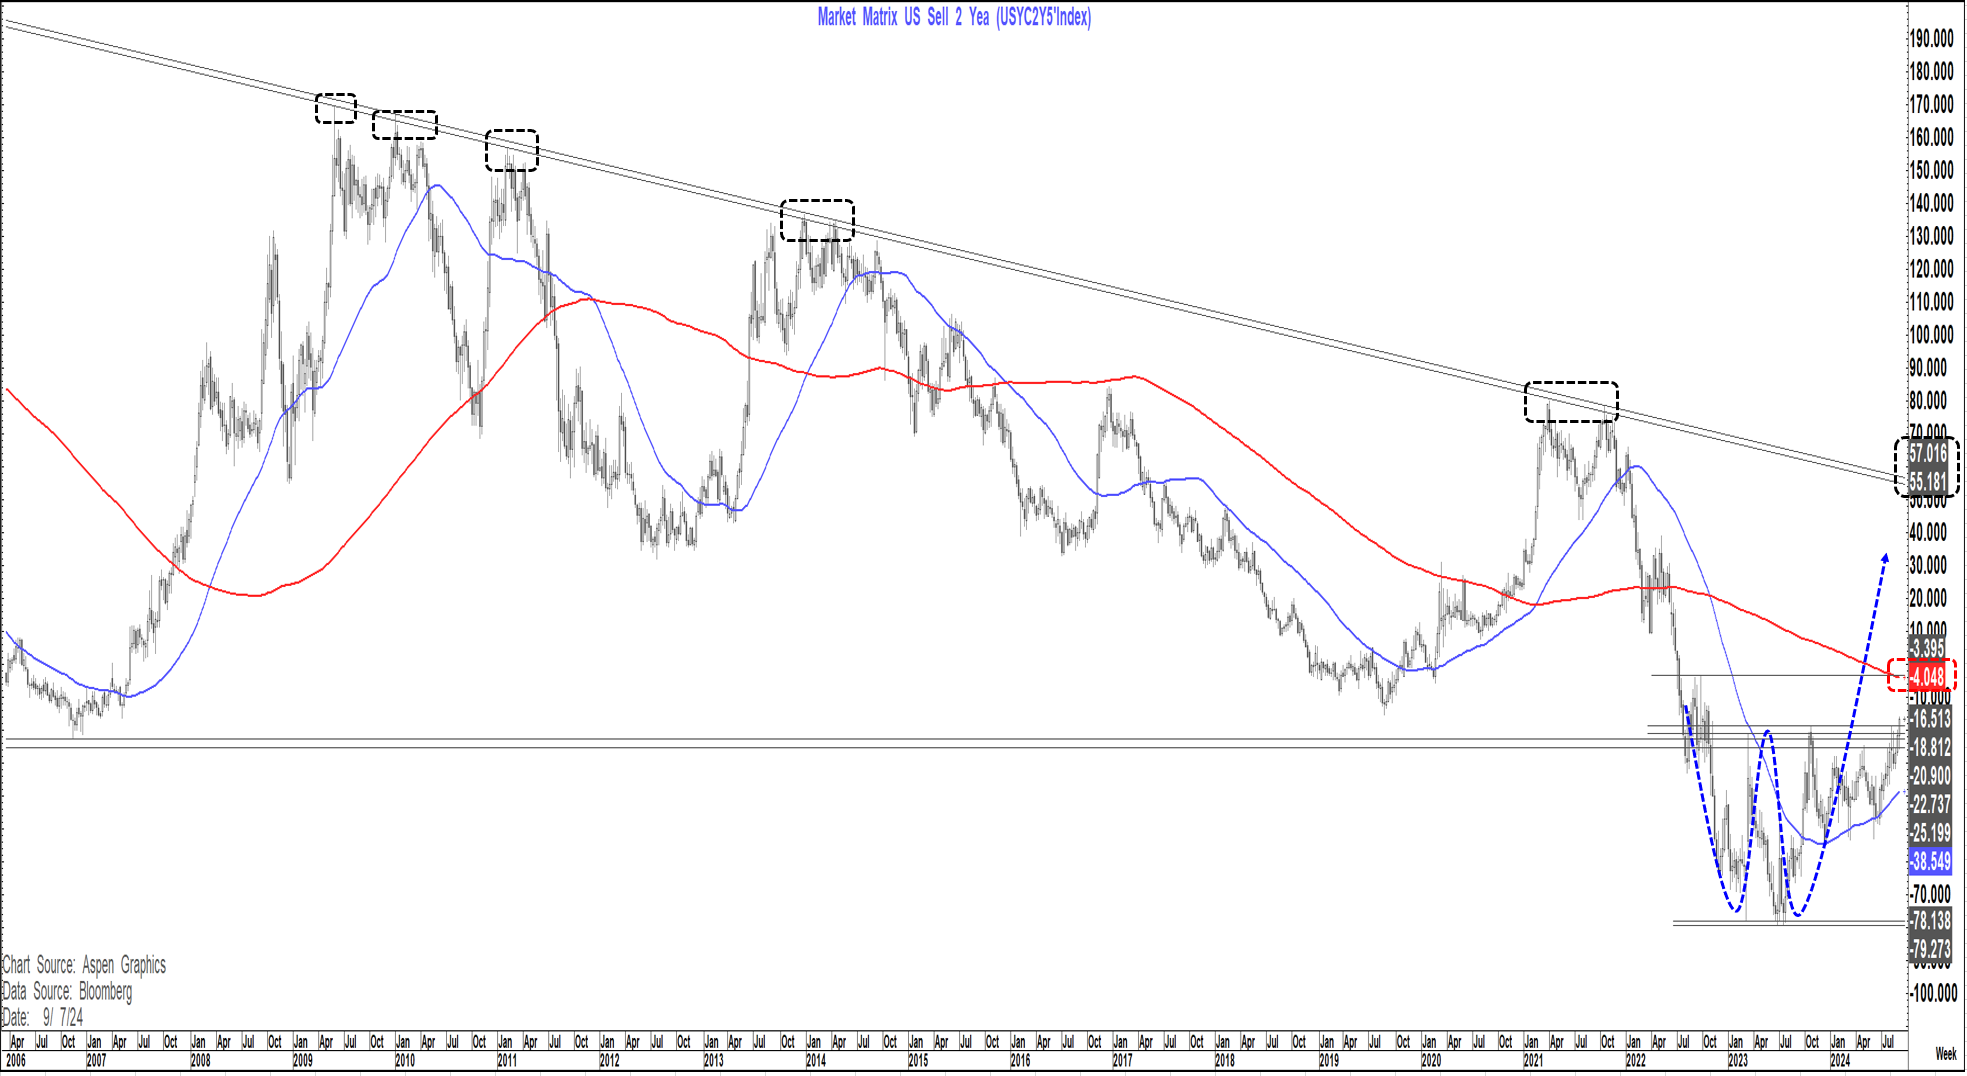
The 2's 5's curve- my Financial Bible
I have explained many times that this curve has been my Financial Bible for over 30 years and despite the plethora of "it's different this time" calls (as we also saw and heard in 2006) it would still be very important in signaling what's to come in rates and the Fed.
For over 30 years this curved produced 3 major cycle highs at +160 to +170 bp's and 3 major cycle lows at minus 20 to minus 25 bp's. The Fed never even let it get to minus 20 to minus 25 bp's in 2019 , cutting rates when the inversion had only gone to minus 15 bp's using their new pre-emptive strategy.
The 3 inversions to minus 20 to minus 25 in this curve happened on
29 March 1989- Minus 22 bp's. The Fed started easing just over 2 months later in June 1989.
23 November 2000- minus 25 bp's . The Fed started easing about 1 1/2 months later in Jan 2001.
16 November 2006- minus 23 bp's . The Fed started easing nearly 9 months later once it managed to take off its "inflation fighting" boots.
This time a few things were different. We provided increased buffers in the way of the biggest fiscal and monetary stimulus in the history of mankind, huge transfer payments (Covid) and a savings rate that grew to 32% of disposable income. This has allowed the economy and markets to absorb these rate hikes better than otherwise and for a surge of activity as people got out of "Covid Jail". But now the savings rate is gone, monetary policy is tight, nominal growth is collapsing, unemployment is rising and the "chicken is coming home to roost"
This time around the curve went like a knife through butter at that minus 20 to minus 25 support and hit a low of minus 78 bp's in both March and July 2023. This as the Fed played catchup to the "transitory inflation" narrative.
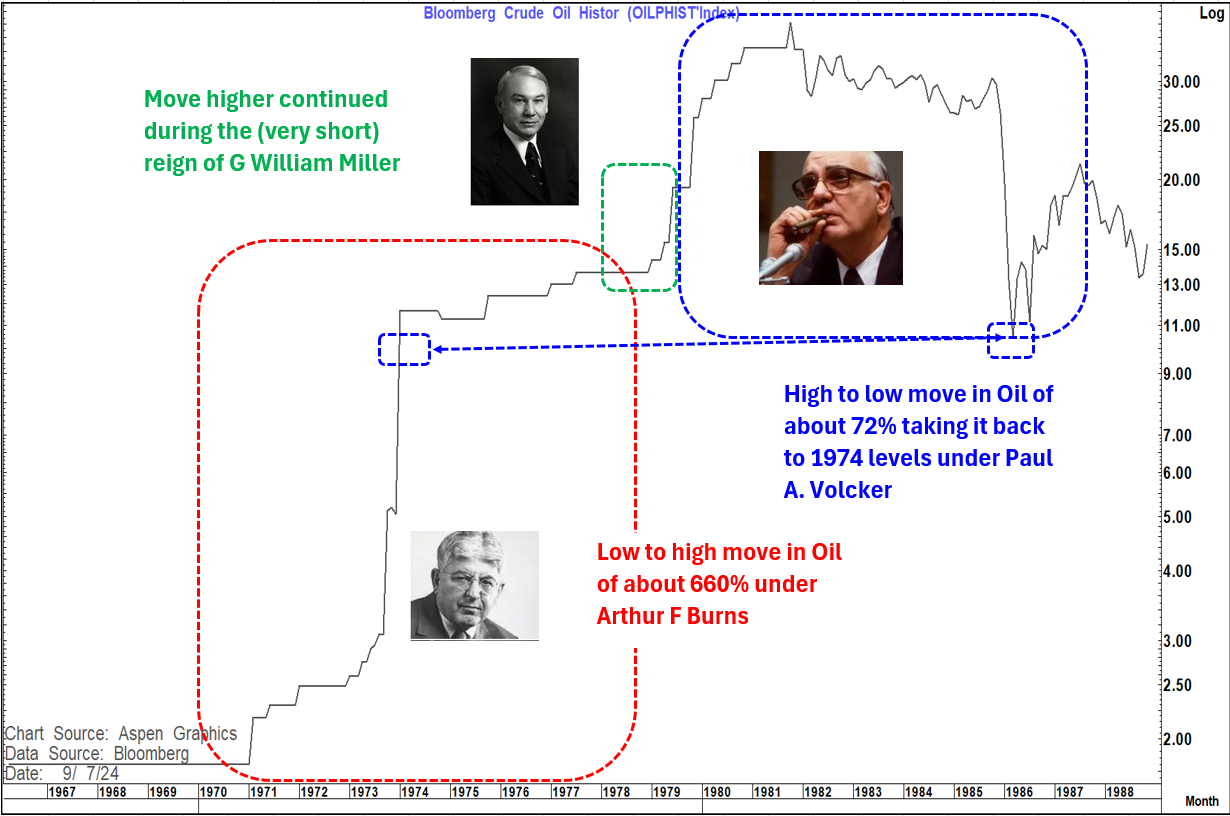
The last time it went from elevated levels below the minus 20 to minus 25 area was in 1978-1979 and it went to...you guessed it minus 78 bp's on 25 January 1979.
The Fed funds rate was at 10% and the Fed was not prepared to budge on the fight against inflation under Volcker who chose the right thing over the easy thing. As a consequence, the Fed began raising rates again in April 1979 taking them to 15.5% by October that year driving the curve below minus 100 bp's and ultimately to minus 172 bp's by March 1980 as the Fed hiked to 20%
In Jan 1979 Core PCE was 6.8% and still rising and did not peak until close to 10% in November 1980 with Core CPI hitting 13.6% by June 1980 . Headline CPI hit 14.8% in March 1980.
But this is not the 1970's .
In the 1970's Oil went up by a factor of about 20 times in 2 sharp moves between 1970 and 1974 and again in 1975 to 1981. Between January 1979 and October 1981 that rally alone was about 180%. Today WTI is about 54% below the July 2008 peak, 18 % below the level on the day before the Hamas attack on Israel in 2023 and about 27% below where it was the day before Russia invaded Ukraine
One could argue that as good as Volcker was the rise in oil and subsequent fall was a much greater inflation driver than the monetary policies of either Arthur F Burns (1970-1978) or Paul A. Volcker (1979-1987)
Today's backdrop is much more like the period after the inflationary stress of the 1970's and before the "World of Covid" when core PCE moved below 3% in 1992 and then spent nearly 3 decades in a range mostly between 2.7% and 0.90%. It is now back at 2.6% and with high base effects as we move into 2025 likely to move lower still.
This is why we had another development on Friday which I think is very important
After nearly 18 months of unsuccessfully trying to establish at least a weekly close above pivotal resistance at minus 19 to minus 21 bp's the 2's 5's curve closed with a weekly break above that range at minus 16.5 bp's.
This opens up the way initially for a move towards the 200-week MA target and trend line resistance at minus 4 basis points but ultimately towards the double bottom target at around +35 bp's and above there possibly downward sloping trend line resistance at 55 to 57 bp's
This is doubly important as it is taking us back into the more than 3-decade range established pre-covid
The longest lag in all these cycles from maximum inversion to when the Fed moved was in 2006-2007 at 9 months. Even If we generously measure from the re-test in July 2023 of the minus 78 bp's low set in March we are now not going to see a Fed first move until 14 months after the trend low (18 months if we use March) far exceeding the delay in 2007 which saw the worst overall result going forward.
In 1989 the curve first went positive in July (Fed cut 63 bp's that month), In 2001 in January (Fed cut 50 bp's that month) and in 2007 in June (Fed cut 50 bp's on 18th Sept.)
So, my sense is that a move into positive territory on this curve, if seen, will be the final "nail in the coffin" here and flash warning signs for what is ahead.
What will the Fed do on 18th September/
We all know that they will cut but will it be 25 or 50.?
The only person that matters here is Jay Powell. All the other chatter is noise. He has led this Fed through a crisis as did Volcker, Greenspan and Bernanke. It is now his Fed. When jay pivots- The fed pivots.
What will he want?
I honestly thought that his body language at Jackson Hole was very negative. He tried to put a good spin on it but clearly the NFP revisions had shocked him and the data since will not help. He knows they have got it wrong. He knows that they are behind the curve but in his mind, what is the trade off?
Does 50 signal that concern and possibly spook markets? I don't think it will spook them anymore than the charts above already suggest they already are.
I think he is going to "cave" and go 50 (My friend and astute Market commentator at In Touch, Andrew Grosso thinks 25- we have been on this page together for quite some time.
But if Jay falters and goes 25 on Sept 18th, then I think the "Ghosts of crises past" are going to start to haunt him very quickly as Financial Markets react badly to the continuation of this battle with yesterday's war in favour of the past but to the detriment of the future.
**An audio version of this piece is below***