Back In January 2024 a very bullish technical picture developed in Chinese equities (with particular focus on the HSCEI index) that suggested the potential for much higher levels. That ultimately led to a rally of over 40% by May before it started to fall again into the August lows.
Today's stimulus announcements from China can be viewed two ways.
Positive that they are stimulating aggressively
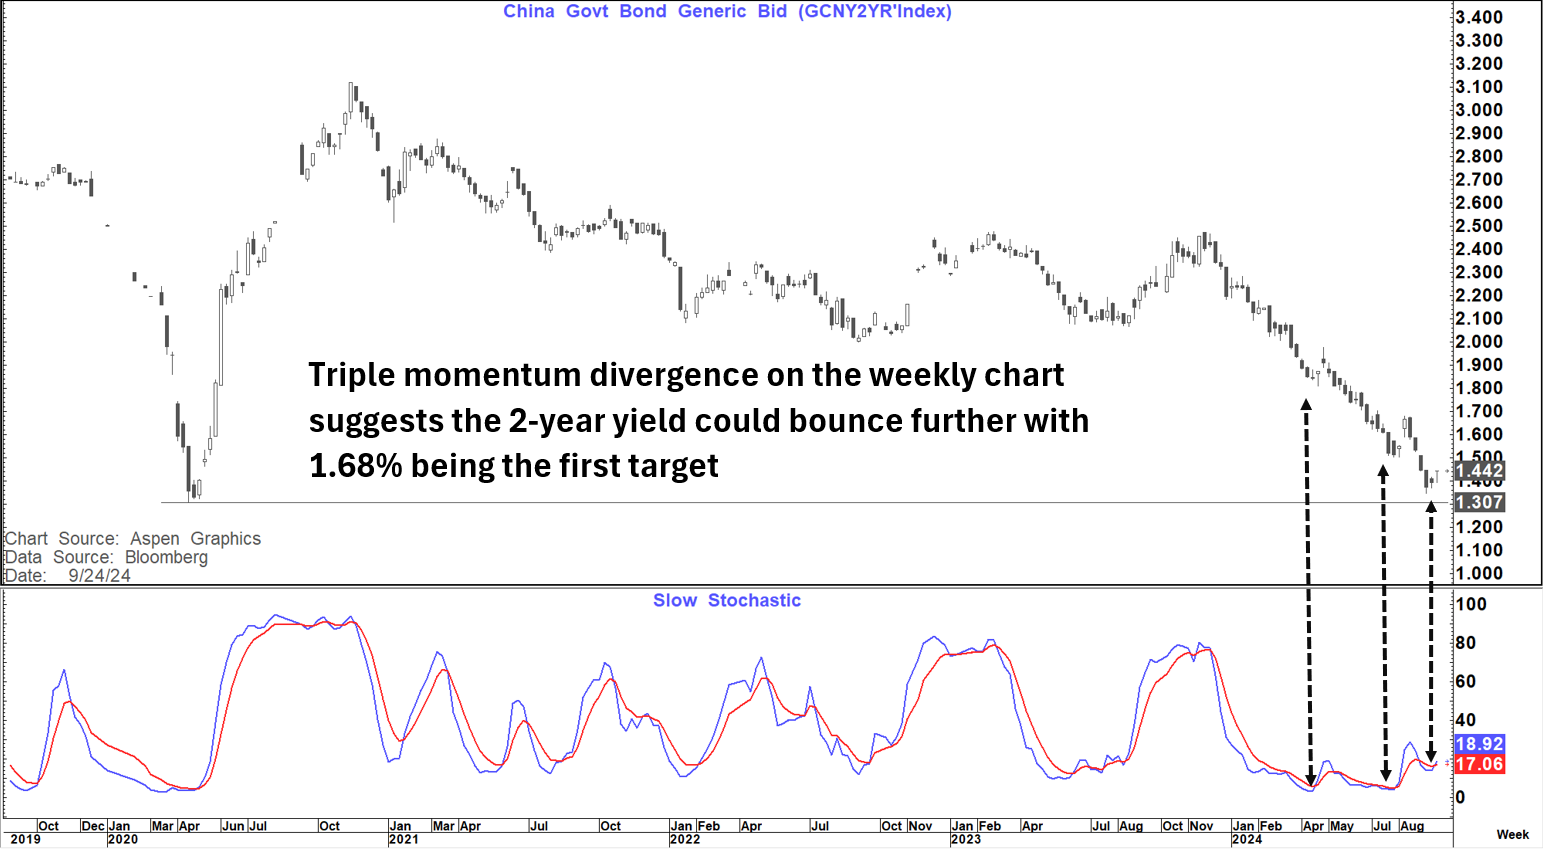
Negative that they have to stimulate this aggressively with the China 2-year yield having already gone to 1.35% recently just 4 basis points above the low it collapsed to in Covid at 1.31% in April 2020.
The chart above suggests that we could now bounce here with triple momentum divergence on the weekly chart suggesting a move towards at least 1.68%.
This probably makes sense on the stimulus announcement which targets growth and inflation.
Details of the stimulus package
How does the HSCEI (Hang Seng China Enterprise Index) look now?
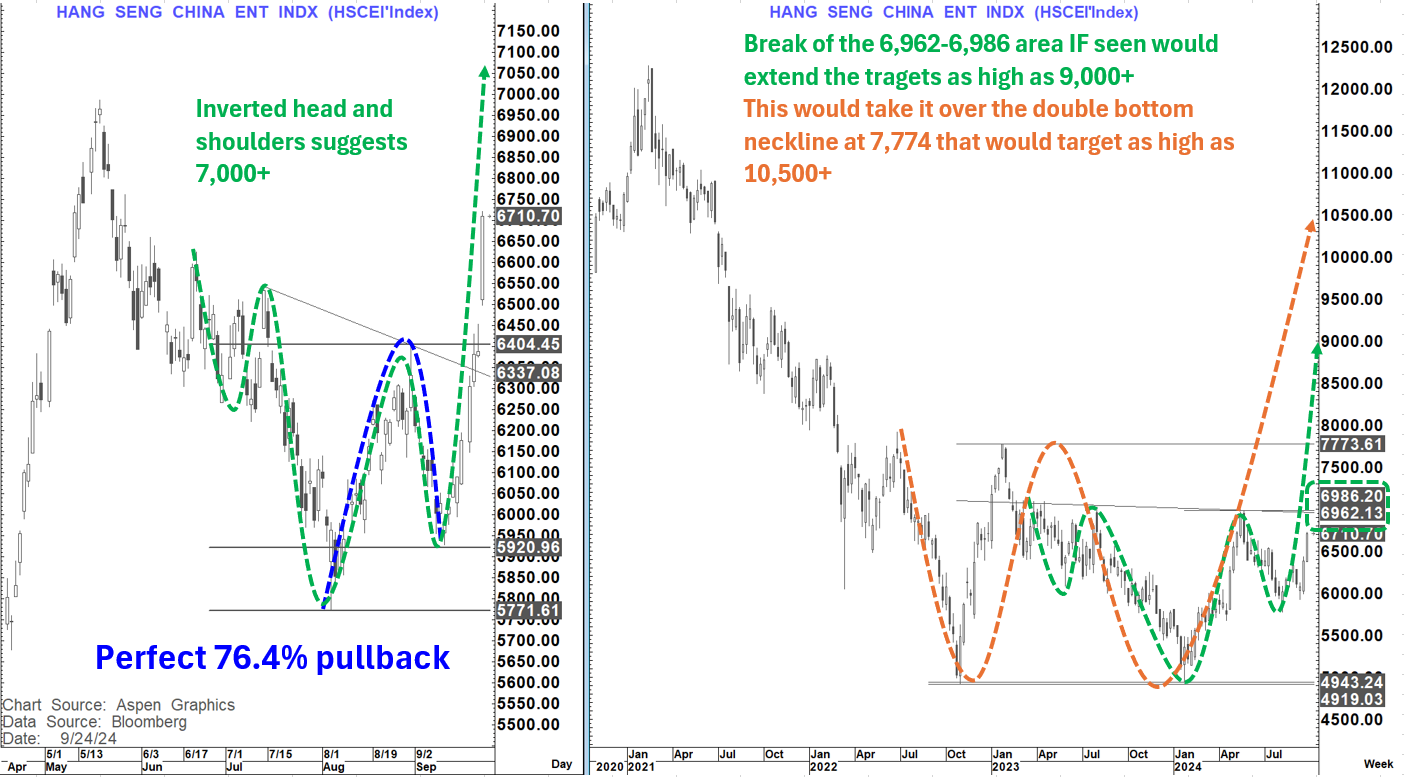
On the daily chart it looks quite positive. We saw a strong bounce off the 5 August low that then corrected with a perfect 76.4% pullback, and we have now surged through that initial high (acceleration point). In the process it has completed an inverted head and shoulders that suggests as high as 7,000+ again.
On the weekly chart there is a bigger inverted head and shoulders potential with a neckline at 6,962 and the May high at 6,986. A weekly close through here, if seen, would suggest extended gains as high as 9k.
That move if seen would also open up a possible major double bottom above 7,774 that could target 10,500+ again.
Time will tell if we get those building blocks but for now those initial levels around 6,962 to 6,986 look very possible.
BUT...and a big BUT all the targets above are predicated on the perception of success.
The initial market reaction to an aggressive monetary policy change is to anticipate success and equities rally accordingly.
But as we saw when the Fed reduced rates by an initial 50 bp's on 18th September 2007, that success is not a given. Back then (as now also after the 50 bp's cut on 18 sept 2024) the US equity market moved to new all-time highs on the "presumption of success".
However, history shows us that we were "Too late to the game" in 2007 and once that happens the level to which policy is behind the curve, and the level to which it needs to be taken, becomes "Off the charts"
Does the magnitude of the recent moves in Chinese yields flag that warning?
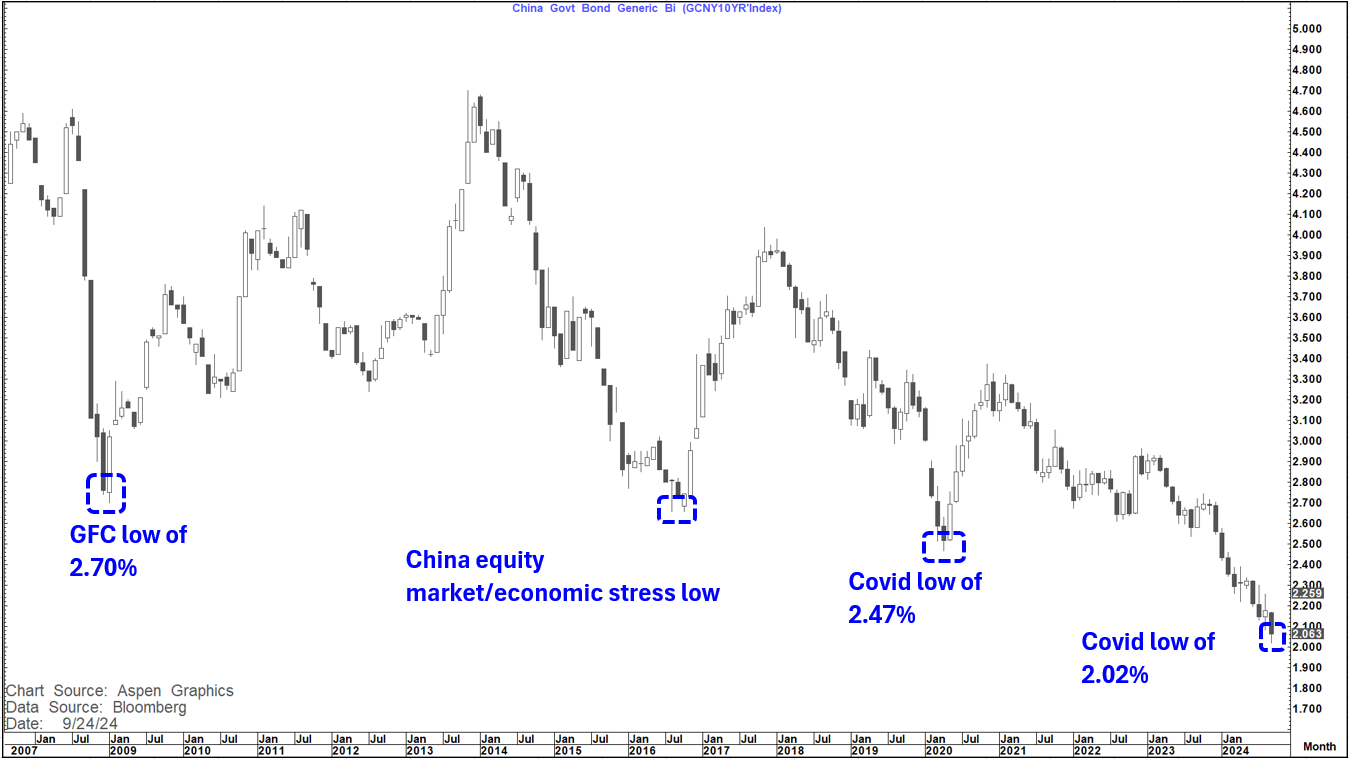
While the 2-year yield in China hit 1.35% the 10-year yield also fell sharply to a low of 2.02% (Hit today). Compare that to a Covid low of 2.47%; a 2016 low of 2.66% (China equity market/economic stress) and a GFC low of 2.70%.
This interest rate move created classic bull steepening just as between Dec 2023 and Sept 2024 we saw the China 2's 10's curve classically bull steepen from +23 bp's (almost identical low to November 2020) to +74 bp's (4 basis points higher that the Oct 2022 peak)
During that period (Nov 2020 to Oct 2022) we saw the Chinese 2-year yield fall 110 bp's compared to 111 bp's from Nov 2023 to Sept 2024.
Then as the curve retraced 25 bp's into Feb 2023 we saw the China 2-year yield rise 44 bp's to a peak of 2.46% (A level tested again in Nov 2023 as a double top was formed and yields began to fall again)
While overall the moves in both these periods in yields and the curve were very similar this time around, they took place in less than half the time
A strong equity market rally was seen between October 2022 and Jan 2023 (HSCEI rose 58% in this period) before everything faltered again.
The other thing that began in October 2022 was a surge in the CNH. Between October 2022 and Jan 2023 USDCNH fell from 7.3750 to 6.6975
We already know that this time around
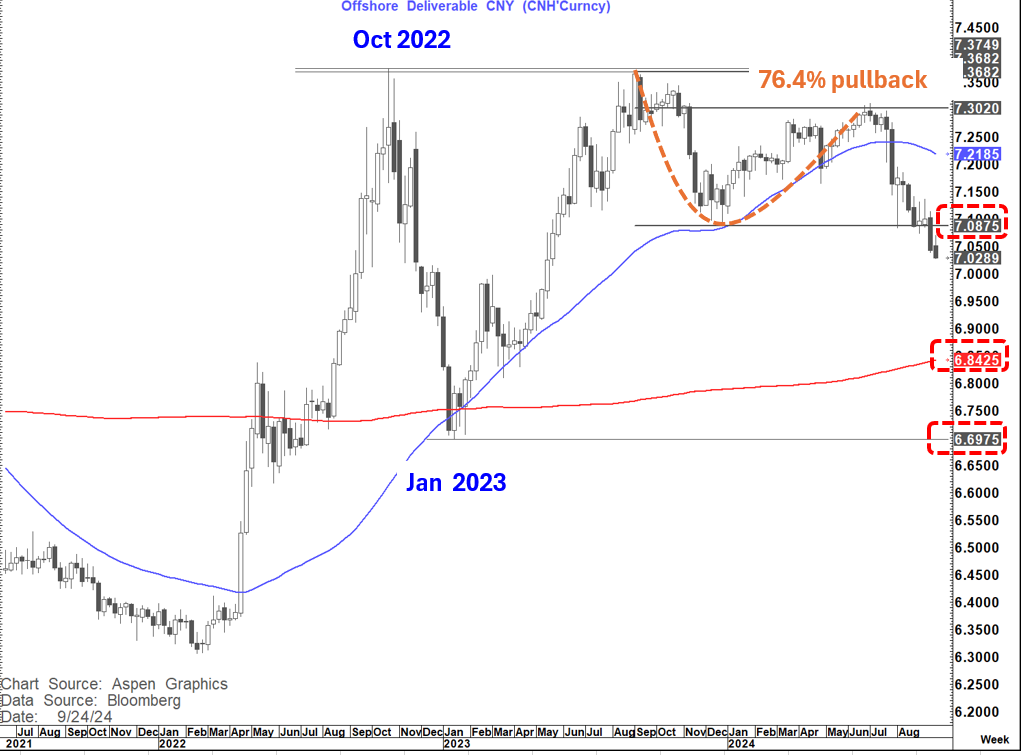
USDCNH topped out at very similar levels to October 2022
The subsequent fall saw an almost perfect 76.4% pullback into July before it started falling again (posting a bearish outside month in July)
USDCNH broke the 55-week MA in end July/early august suggesting extended losses towards the 200-week MA which is presently at 6.8425.
USDCNH has further validated this by breaking below the pivotal support at 7.0875 (off which the 76.4% pullback was formed-making it a big inflection point) suggesting at least the 200-week MA move is possible if not back towards the Jan 2023 lows at 6.6975.
Back in that period USDJPY was falling faster than USDCNH and CNHJPY fell sharply. That had also been the case until last week when USDJPY and CNHJPY both posted bullish outside weeks (As BOJ gave a very good impression of being a reluctant hawk in the wilderness).
A bullish outside month on USDJPY is next to impossible to see this month (September close over 150.89) but not so much on CNHJPY. It just needs a monthly close over 20.8035 (high so far 20.675). All this suggests that more outperformance by CNH looks likely for now.
It is also worth noting (given China's outsize influence in global FX markets) that between October 2022 and January 2023 the USD index (DXY) fell high to low about 11% while the Bloomberg USD-index (BBDXY) (which includes CNY) fell about 10%. USDJPY fell about 16% (as CNHJPY also fell as noted above) . EURUSD rallied nearly 13.5%
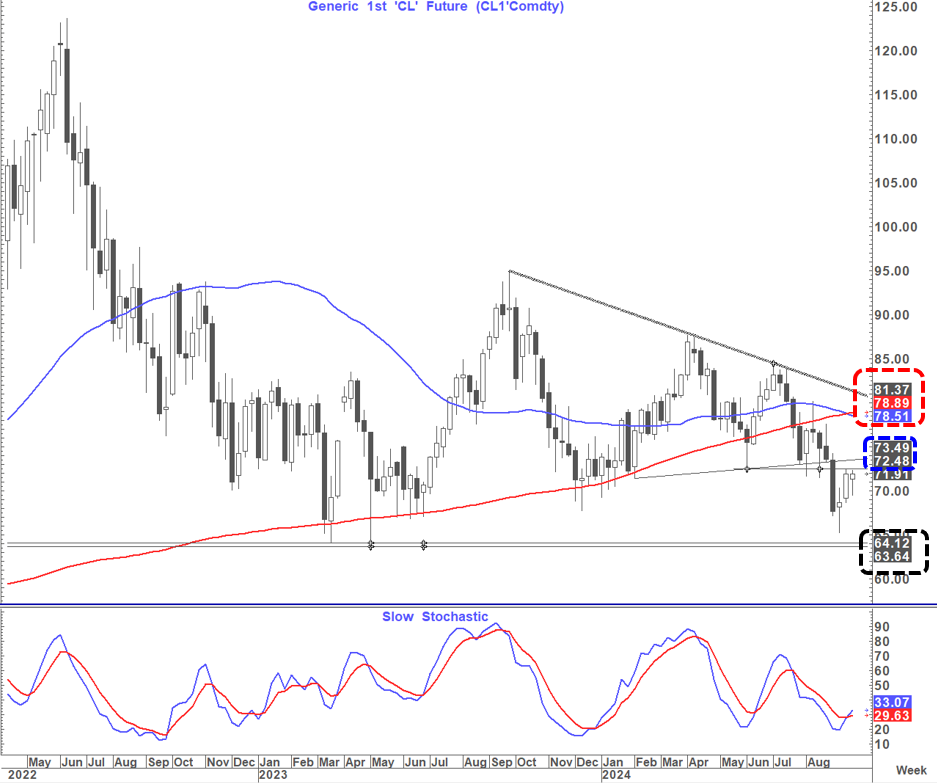
Overnight we have also seen Oil bounce quite sharply with WTI up 2.10% as I write this note. Up until now most bounces in Oil have been more Geopolitical than economic and have not been sustained for long.
Is this different?
Between Oct 2022 and Jan 2023 Oil did not sustain any bounce of note, so it is not clear this time will create a sustainable move either.
For now, however, WTI did manage to hold above major support around $64 and bounced with weekly momentum turning higher. IF, however, it was to sustain a weekly close above $72.50 to $73.50 it would then suggest a danger of a move towards $78.50-$81.40 again but I would not pre-empt that break and possibly even fade it
Copper (HG1) has also moved sharply higher overnight (2.73%). initial resistance is at $450 and then $468 and at this point a further squeeze higher does look a danger albeit as yet there is no signal to suggest that this is a sustainable turn higher.
It is hard not to imagine that this policy shift will also support Gold and Bitcoin both of whom already look positive technically.
The 2022 correction lower in Gold did bottom out in September and by January 2023 it was over 20% higher. Bitcoin turned higher in November that year and by January had bounced about 55%off its lows.
Between October 2022 and Jan 2023, the US 10-year yield fell over 100 bp's.
This is somewhat interesting as November is the 2nd best performing month over the last 25 years for TY1 rallying on average 0.55%.
In 2022 it was by far the best month of the year rallying 2.37% and in my "Analog" years of 1990,2000 and 2007 it rallied 2.32%, 2.16% and 3.55% respectively.
The DXY also fell in November in those 3 years and in November 2022 fell 5%.
So, for now, these Chinese developments look material and look like they could be supportive the Chinese equity market and the CNY/CNH in particular but also potentially Gold and Bitcoin and possibly negative the USD.
We will probably see a bounce in Chinese yields and a flattening of the curve also.
On the US side the suggestion is still that US yields could still be choppy in the coming weeks but thereafter may well start to fall again
In the near-term monetary stimulus from the 2 largest economies in the World probably broadly helps stock markets globally as well.
But there is a thought we need to have in the back of our minds
Is the perception of success, correct?
In 2007, with the US it was not. In my recent diary piece Diary: Week 60- we have A winner I noted that while the 2007 analog was clearly in the ascendancy, we were reaching a point where the backdrop turned increasingly more negative back then (especially as we headed into 2008).
I also noted that at this point that was not necessarily fully apparent when it came to the US economy this time around and we therefore needed to be flexible in our views of this analog going forward.
I also noted that while we would clearly need to see a sentiment shift to sustain the moves seen as we entered 2008 the developments needed to be significant but not necessarily the same.
Is it possible that this time around the "Canary in the coalmine" could be not the World's largest economy but the World's 2nd largest economy (China) in a scenario eerily similar to the turn in Japan in 1990 when it was about to eclipse the US economy. (The big difference this time being that China is also a Global/Military power and we also have the China/Taiwan issue in the wings.
Economic stress is often associated with the deflection of economic nationalism.
I do not at this point know the answers to the above questions, but I do think they are questions worth asking.