So, for pretty much most of this year I have banged the drum about 3 analogs in terms of markets and backdrop that seemed to fit with today.
As we head towards what I suspect will be a pivotal 4th Quarter one of the three is clearly in the ascendancy.
1990: This was very much with a focus on the relativity of Japan and the US as USDJPY went above 160 in April 1990 (never seen again until April 2024) and the Nikkei approached 40k (Never seen again until 2024).
The BOJ was raising rates and the Fed was easing. In the US we had a recession combined with banking and housing stress.
We still have elements of 1990 today but also some clear differences
-When the S&P peaked on 16th July 1990 it pretty much went down in a straight line falling 20% into the low on 11th October.
- The Fed had already begun easing in 1989 and went on a pause as we entered 1990 (having eased 150 bp's) and from July 1990 to the end of the year eased another 125 bp's. The BOJ had started hiking in May 1989 and increased rates a further 175 bp's in 1990 taking rates to 6% from a low of 2.25%
So, while there are "rhyming elements" and the underlying direction of USDJPY, the Nikkei, Fed rates and BOJ rates has followed a similar path, the relative magnitude of the respective rate changes is much less.
While we are seeing the Fed ease, and the BOJ tighten it is not at a magnitude of divergence like we saw in 1990 and so will likely have a more muted impact on USDJPY and the Nikkei now than then going forward.
2000: Here the main similarities we see are the Fed easing on the back of a contagion (But financial this time in 1998.) This was the Asia crisis, the Russian default, the failure of LTCM.
The Fed then raised rates to 6.5% taking real yields close to 400 bp's. We saw the Equity market surge in 1999 and into 2000 on the back of Y2k hype and the Dotcom bubble.
The Employment picture began to deteriorate in the summer of 2000.
The S&P peaked and rolled over on 17th July 2000 falling about 7% in into late July before rallying again. A higher peak was set on 01 Sept, 2000 but the S&P did not make a new all-time high above that seen in March.
01 Sept 2000 was the day of the August employment report which was again weak, and the Fed had not responded in its 22 August meeting just before. It also did not respond after that print and kept rates at their peak throughout the rest of the year, cutting only in Jan 2001 as it became clear that the economy was faltering, unemployment rising and the Dot Com bubble cracking.
They then cut 5 times between January and May 2001- all in 50 bp's increments. Who knows if that might have ultimately got them ahead of the curve but 9/11 changed everything and the rate cutting cycle was deeper and longer and the NASDAQ fell over 80% from its peak.
Again, here we see some rhyming but also material differences- in particular the Fed stubbornness in not cutting rates in 2000.
2007: This was a period when the Fed took interest rates to 5.25% and kept them at their peak for the longest period in the last 50 years (15 months) We have just seen them take rates to 5.5% (upper band) and keep them there for 14 months (2nd longest period in last 50 years)
In Aug. 2007 Core PCE was at 2.0 % putting real yields at 3.25%. In august 2024 it was 2.6% putting real yields at 2.9%.
Unemployment deteriorated in the summer of 2007. However, when the Fed cut in September the unemployment rate was just 2/10ths off the cycle low at 4.6%.
This time it is 8/10ths off the cycle low at 4.2%. In addition, back then the participation rate was 65.8% (similar to where it also was in 1990 and 2000) compared to the present 62.7%.
So, there is a good argument to make that the present much lower participation rate than 2007 (and 2000 and 1990) actually flatters that employment picture.
That is before we even talk about the revised NFP numbers, the faulty BDR and the fact that most jobs being created are part-time jobs.
We have seen the US bond market and 2-year yield in particular follow an almost identical path to that seen into this point in 2007.
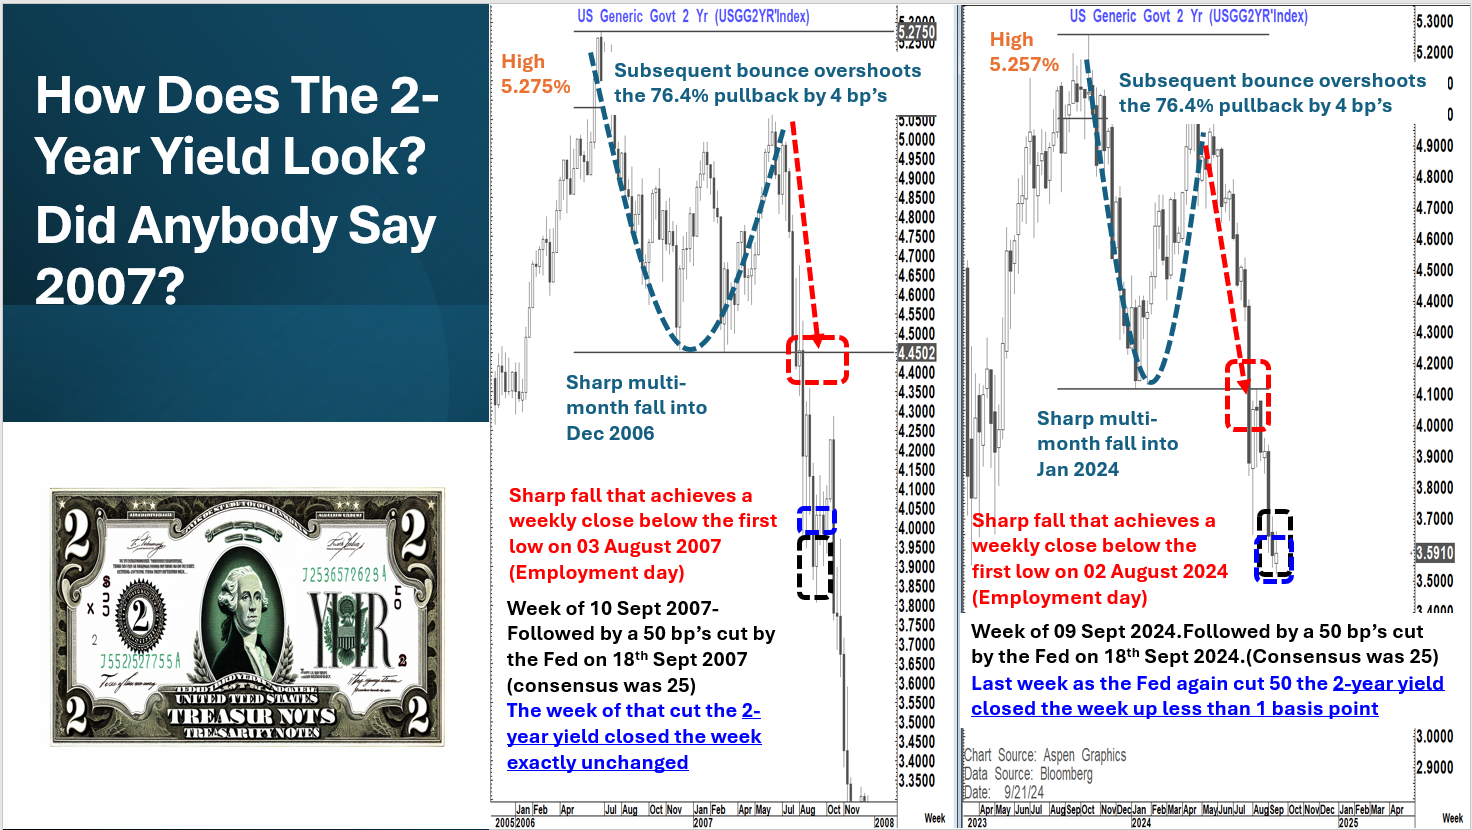
As we can see the similarity in path is nothing short of astounding.
Will that continue? We will see.
What happened in 2007 is that from the unchanged level week on week in the week that the Fed cut it fell again the following week by 13 bp's and closed 5 bp's lower.
Then over the next 3 weeks it went to 25 bp's above the close seen in "Fed week". That would equate to 3.84% this time IF seen.
Then the next sharp move lower in yields began in the week of 15th oct, 2007 as we got another sluggish employment print (Unemployment up 1 /10th, small NFP beat but bigger revision lower of prior month). We have been given very clear guidance that a further deterioration in the employment picture is the bar needed for further "outsized" rate cuts.
The S&P had peaked and rolled over on the 16th July 2007 just as it did on the 16th July 2024.
In 2007 it fell 12% into mid August before rallying again and taking 36 trading days to post a new all-time high. Four trading days later it peaked and turned on 11th october
In 2024 it fell 10% into early August before rallying again and taking 33 trading days to post a new all time high.
In addition, on the week of 15th October, 2007.......from CNN Money.. here were some of the headlines
15 Oct 2007: NEW YORK (CNNMoney.com) -- Stocks tanked Monday, with the Dow posting its biggest one-day loss in more than a month, after Citigroup's weak profit report and record-high oil prices sparked a big selloff.
16 Oct 2007: NEW YORK (CNNMoney.com) -- U.S. stock futures were weaker Tuesday after Federal Reserve chief Ben Bernanke offered no hints about future rate policy and as oil prices soared to fresh highs.
17 Oct 2007: NEW YORK (CNNMoney.com) --Nasdaq gives up gains sparked by Yahoo and Intel; Dow turns negative as investors bail out of IBM and United Tech; oil prices at all-time high.
18 Oct 2007: NEW YORK (CNNMoney.com) -- Stocks struggled Thursday in a choppy session in which weak earnings from Bank of America and another spike in oil prices kept investors from restarting the recent rally.
19 Oct 2007: NEW YORK (CNNMoney.com) --Brutal selloff on Wall Street. Dow down around 367 points, its third worst day of the year, on fears about credit and housing sector, earnings, record-high oil prices, slide in dollar, what the Fed will do next. Stocks tanked Friday as worries about more problems in the bank sector, slower corporate earnings growth, the weak dollar, and record-high oil prices all came to a head.
We saw a massive weekly reversal of the bounce high that week in the 2-year yield that saw a very sharp fall in yields for the rest of the year with the equity market having peaked the prior Thursday.
As we now know, but did not at that point realise, we were heading into the greatest financial crisis of a generation that bubbled in sub-prime (contained at the time according to Ben Bernanke) and fed into the housing market, the stock market, the banking system and ultimately the economy.
This is an important comparison.
In that respect I often use the chart below to make a point about looking at historic analogs and comparing them to today.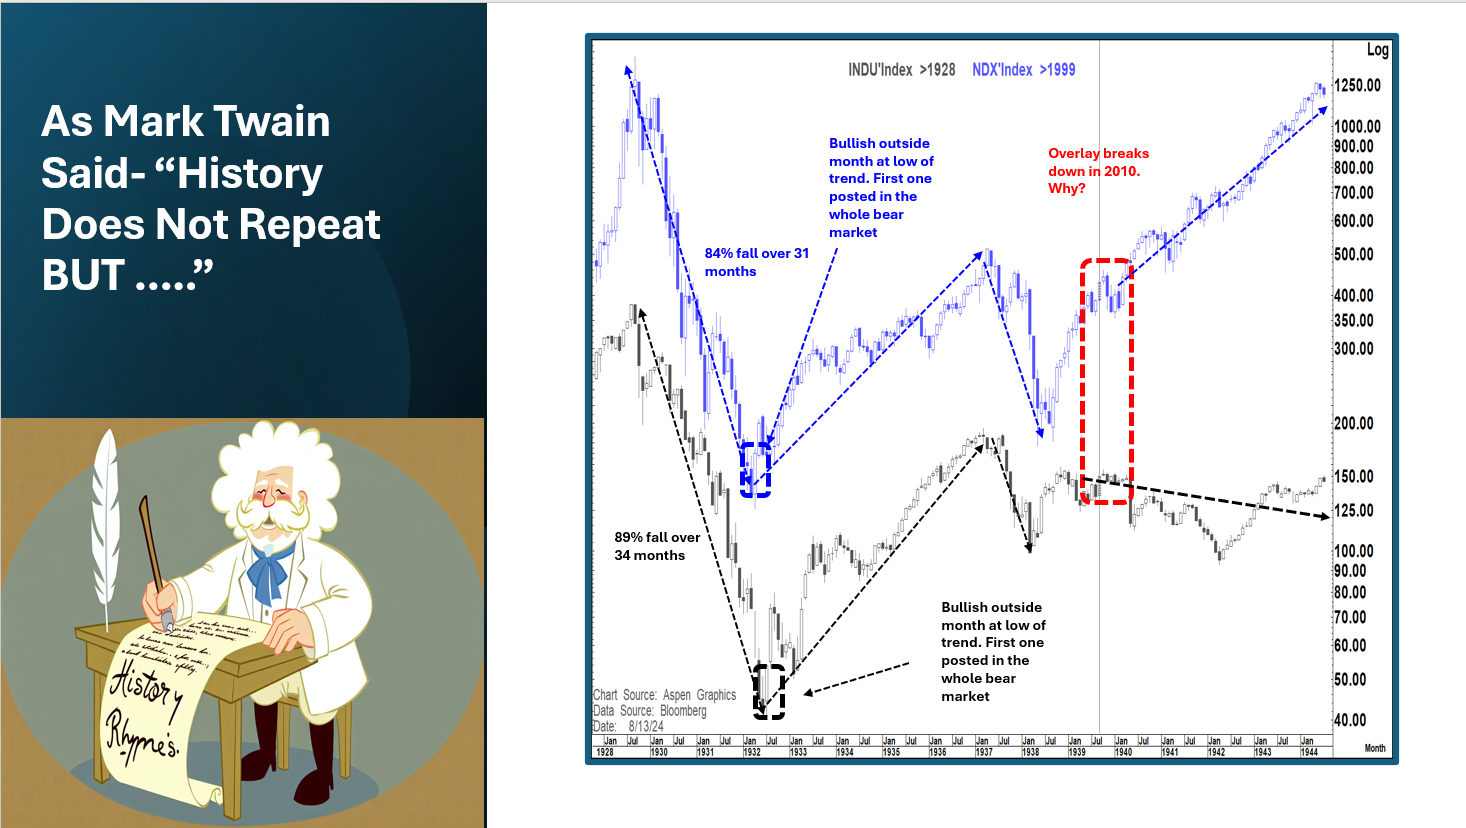
This is an overlay showing the collapse of the NASDAQ by over 80% in 2000-2002 and comparing it to the collapse of the DJIA between 1929-1932.
The similarity as you can see is amazing, not just in the period of collapse but even for a substantial period afterwards. In fact, this analog remained amazingly similar for literally a decade.
But then as per the red box on the chart above the analog broke down. Why?
There is always a danger with these long-term analogs that either something major happened historically which just does not look to be in the frame today or something major happens today which did not materialise historically. The event does not have to be the same, but it is an event of large magnitude that cannot be "matched" then there is a high likelihood that the analog breaks down.
That point of divergence in the chart above corresponds to 1939 and the outbreak of World War 2 and that is when the analog broke down.
Today we have to recognize that in the 2007-2024 analog we are close to the point at which the GFC began in earnest and while we have CRE concerns, regional bank concerns, a bit of an equity market "AI/Mag 7" bubble, it is not clear we are on the cusp of another GFC.
I think this matters less in the coming months but is very meaningful as we head into 2025.
That is not to say that there are not tail risks today. After all we have.
-The Russia - Ukraine war
- The Middle east conflict
- China's economic woes and the Taiwan question
- A hugely polarised political backdrop in the US and to a certain extent other countries
- A struggling Global economy
- A debt dynamic in the US that is heading out of control with a debt to GDP over 120% with elevated funding rates. Our interest bill has now moved above $1 trillion annualized. We have about $106k in debt for every man woman and child and about $260k per taxpayer. We grew out national debt to about $6 trillion from 1776-2006 and added another $29 trillion in the subsequent 18 years. We are clearly on a path to unsustainability.
-Possible unknown tail risk that we don't even know about yet
So, at this point the clear winner in the analogs has been 2007 versus 2024 and there is no reason to abandon that path FOR NOW.
But, a bit like the Fed, we are now moving into a much trickier period with a number of moving parts.
We know what happened in history at this point and the extent to whether we see similar developments taking place (or not) as we move into 2025 will likely determine the likelihood that this continues to be the path/analog to follow or whether we are getting to a point that is "different this time".
Now is not the time to be complacent as we are likely getting close to a very important pivotal point in this whole historic comparison. We know what happened historically and we now need to be just as vigilant in looking for differences as similarities.
For now, the 2007 roadmap is still alive, and I will remain focused on the subsequent policy, economic and market paths we saw back then unless and until we start to realise more differences than similarities.
IF, that happens then hopefully, we will be able to construct an appropriate playbook for what 2025 may hold.