We have had the first trading week in a year that promises to be anything but dull. Already we have had some material moves and some interesting developments.
What stands out at the end of Week 1?
The reality is that not all of the moves suggested in this piece may materialise in the days or weeks ahead.
However, what does seem clear is that for all these disparate paths to come together as suggested would likely need us to move into a "risk off" environment
So for now that is what I will be watching closely for any signs that these building blocks are converging.
What stands out at the end of Week 1?
Rates:
Rates have been choppy, but the setup shows some similarities with both April and November 2024. That suggests that in the near-term we may have a danger of seeing lower yields in at least a short-term correction.
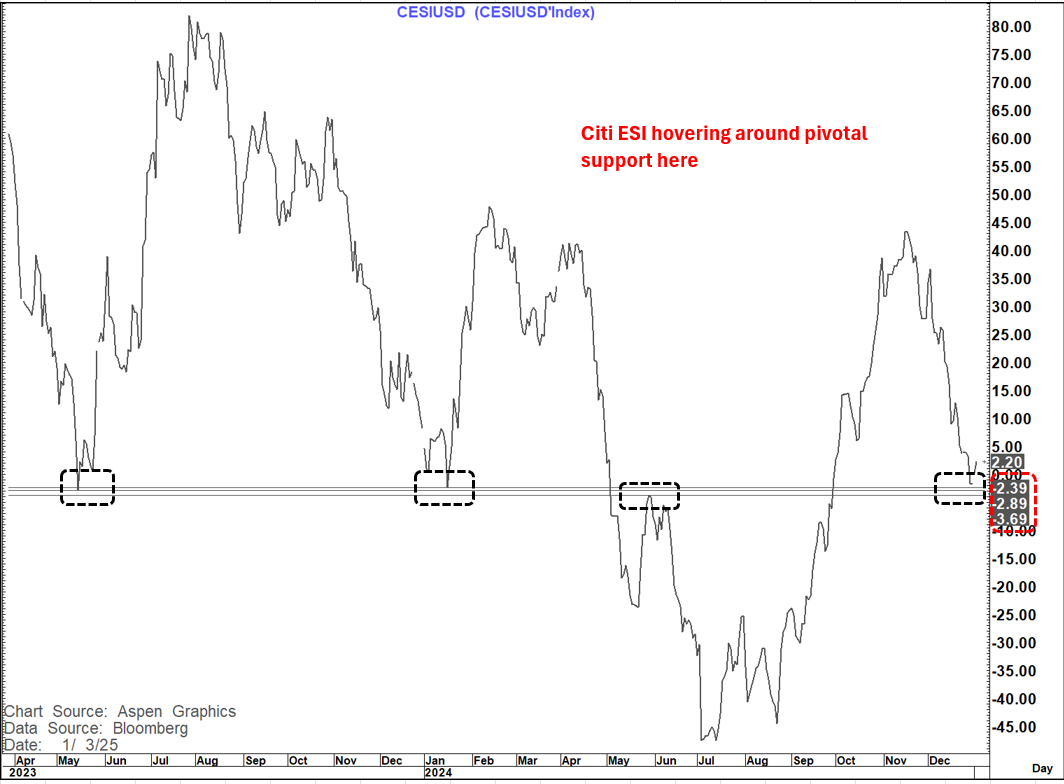
US 2-year yield still has good support a 4.21% and a close below would signal an extended move to at least 4.14% with a very pivotal level at 4.075%. A break below there would be a big deal but the bar for that is high. We would likely need to see a significant deterioration in Economic data (We have seen the Atlanta GDP forecast revised down and the Citi Economic surprise index has been falling but Employment and inflation remain the key drivers here) or further pressure on the equity market to deliver a material move lower in yields outside of the short-term bias. 4.38% is the main topside level to watch.
On the 10-year yield the levels to watch below are 4.49-4.50% and then 4.44% while the big topside pivot is 4.64%
On the 30-year yield the initial level is at 4.72% with a more material level at 4.48%. On the topside we have a very pivotal range at 4.825-4.845%
Momentum is also flagging a little on the 2's 30's curve having effectively reached its initial 55 to 60 bp's target (High was 56 basis points). A move back towards 48 to 48.5 bp's and possibly even 37 to 40 bp's looks a danger here short-term. Longer term targets still remain much higher here.
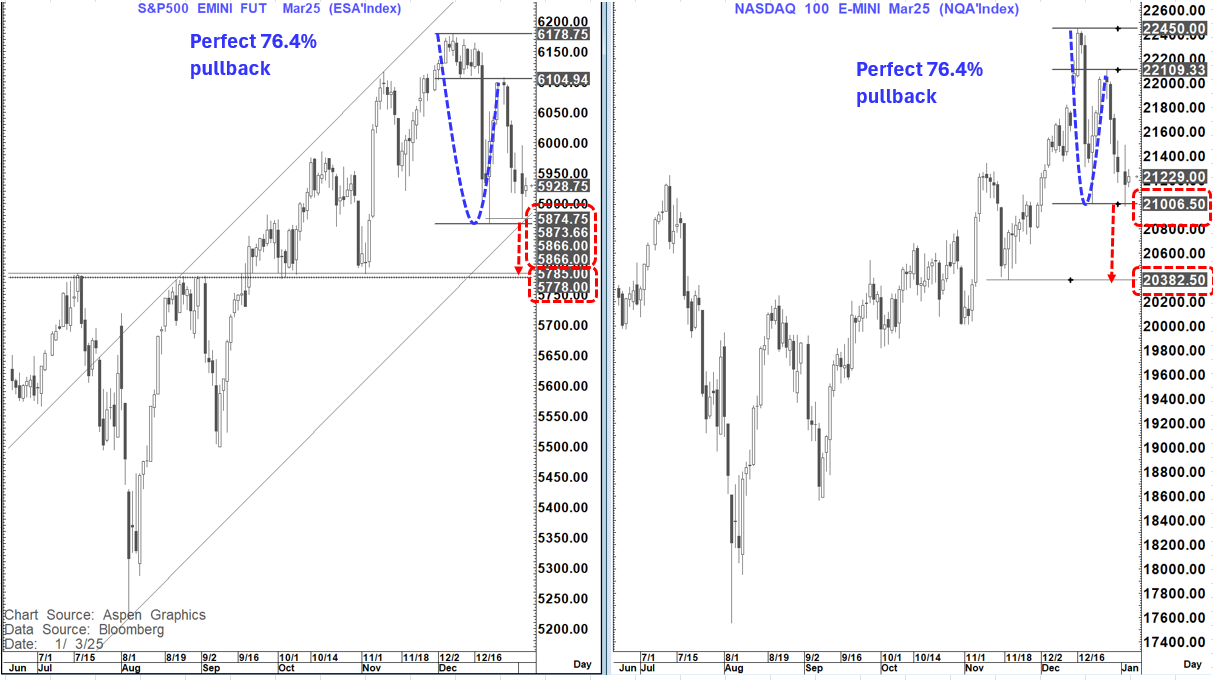
So what about equities.
Both ES1 and NQ1 have already tested pivotal short-term supports and held so far. A beak below those levels, if seen, at 5,866-5,875 and 21,006 respectively would suggest another acceleration lower.
Such a development, if seen, could also be a possible factor that could weigh on yields.
FX also looks interesting this week
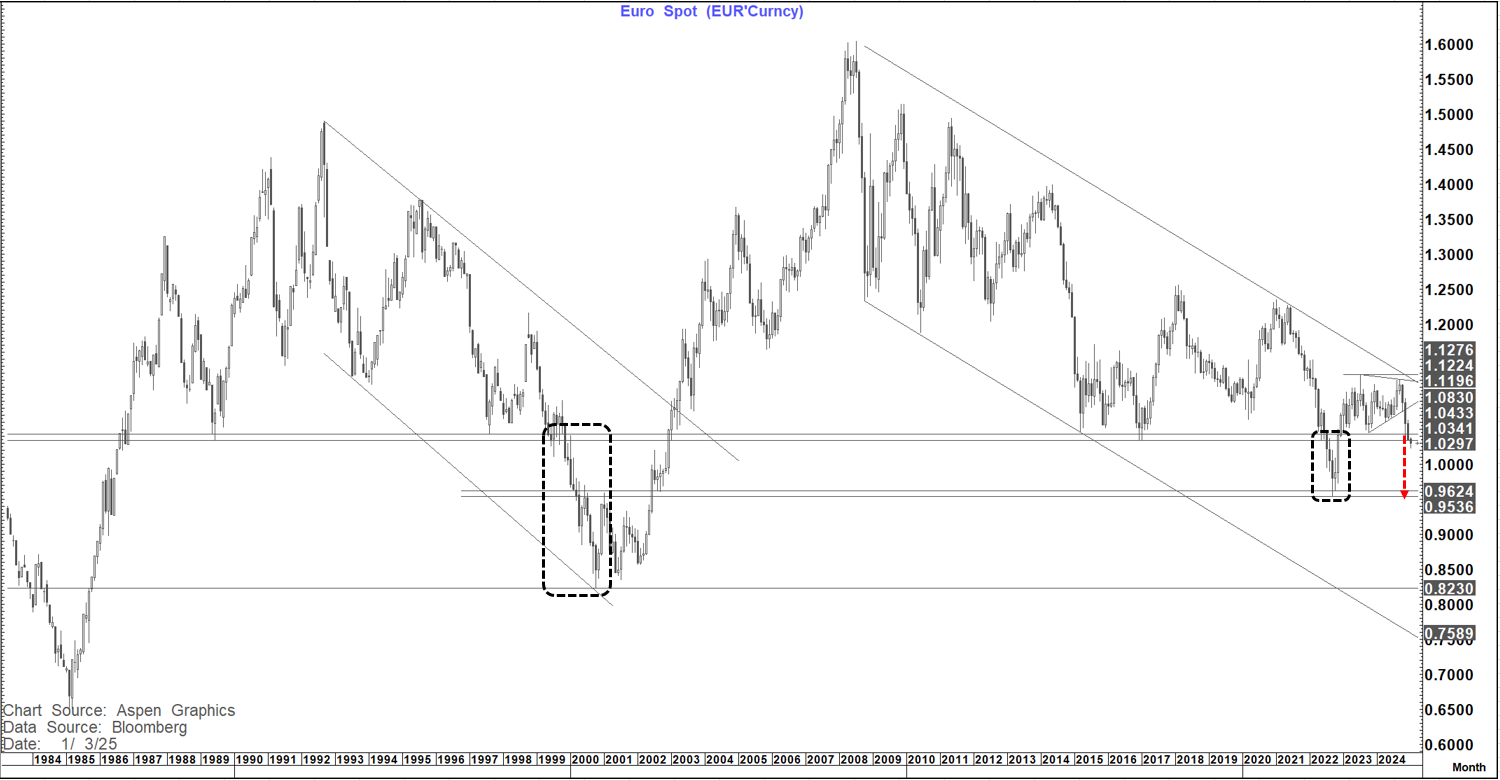
In particular EURUSD which is in line to both post a bearish outside week as a continuation as well as get a weekly close below pivotal long-term support.
Major supports stand at 1.0335-1.0343 which we have pushed below this week. This is important not just as the November-December lows but on a big picture basis back to the inception of the EURO.
We have seen sustained breaks below here on only 2 occasions-
1999 which ultimately led to a move down to .8230 in 2000
2022- which led to a sustained move over 3 months to .9536
In addition, the weekly and monthly closes seen below 1.0448 complete a double top that suggests a move to at least .9625 to .9700.
IF we close today below 1.0384, we will add a bearish outside week to this equation.
This comes as we also have a likely
bearish outside week on GBPUSD (Below 1.2501) that suggests further losses. We are also in line for a
bearish outside week on EURJPY below 162.77 that suggests
155-156 again and on
GBPJPY below 196.08 that suggests a move towards
188.
USDJPY remains most susceptible to interest rate moves as JPY rates do not move much while in Europe it is more about the spreads moving on relative moves. A move lower in JPY crosses (at the margin) would mostly come from falling US rates that fall less than European rates OR falling US rates in a risk off scenario- hence the equity focus.
Commodities
In that respect we have some interesting Commodity developments.
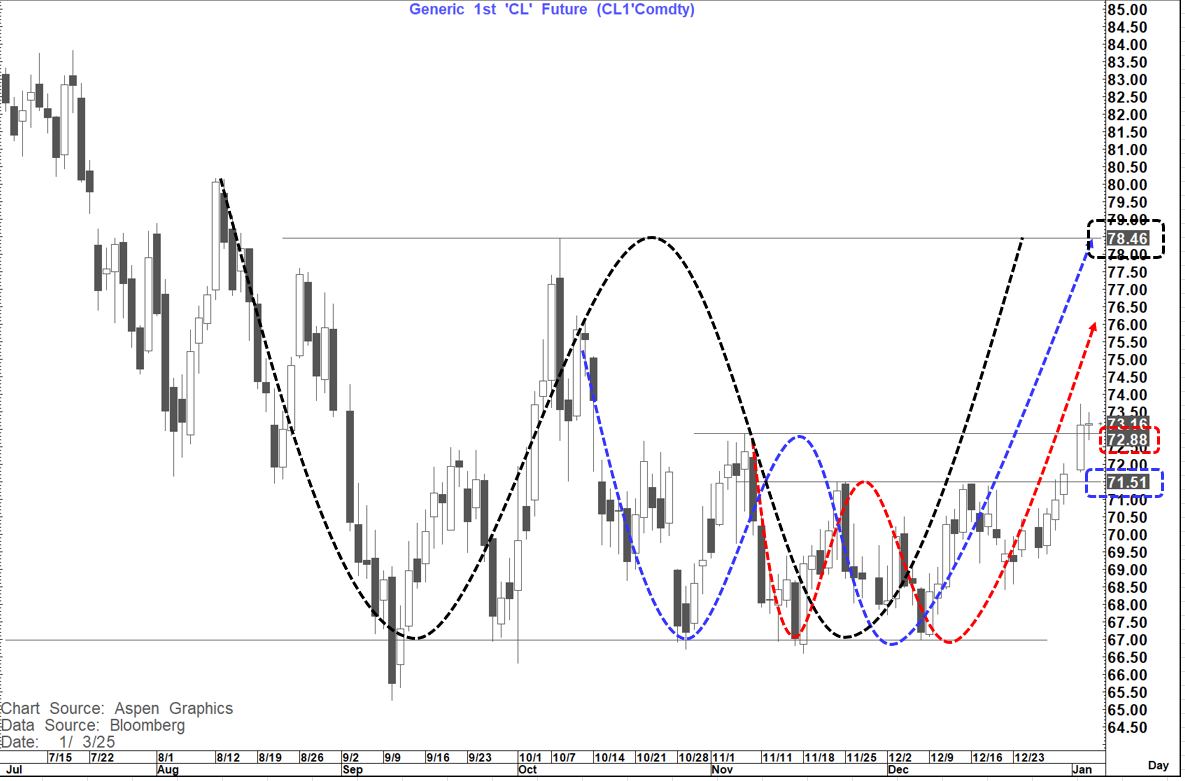
WTI is bid and has already completed a short-term double bottom that suggests a move towards $76. However, it is now above a larger double bottom neckline at $72.88 that suggests (if sustained on a weekly close basis) a move towards $78.50 again. Above there could be a huge double bottom suggesting as high as $90...but that is for another day IF ever.
As a basic rule of thumb, such a move higher if seen would likely feed to higher yields- but really only if it is an economic/demand driven move and thereby potentially inflationary all the way to core inflation.
It is hard to see that as being the case with only the US (driven by debt growth) a growth standout in that respect. Therefore, this move higher is really like a tax on discretionary spending and more likely to feed to risk off than on.
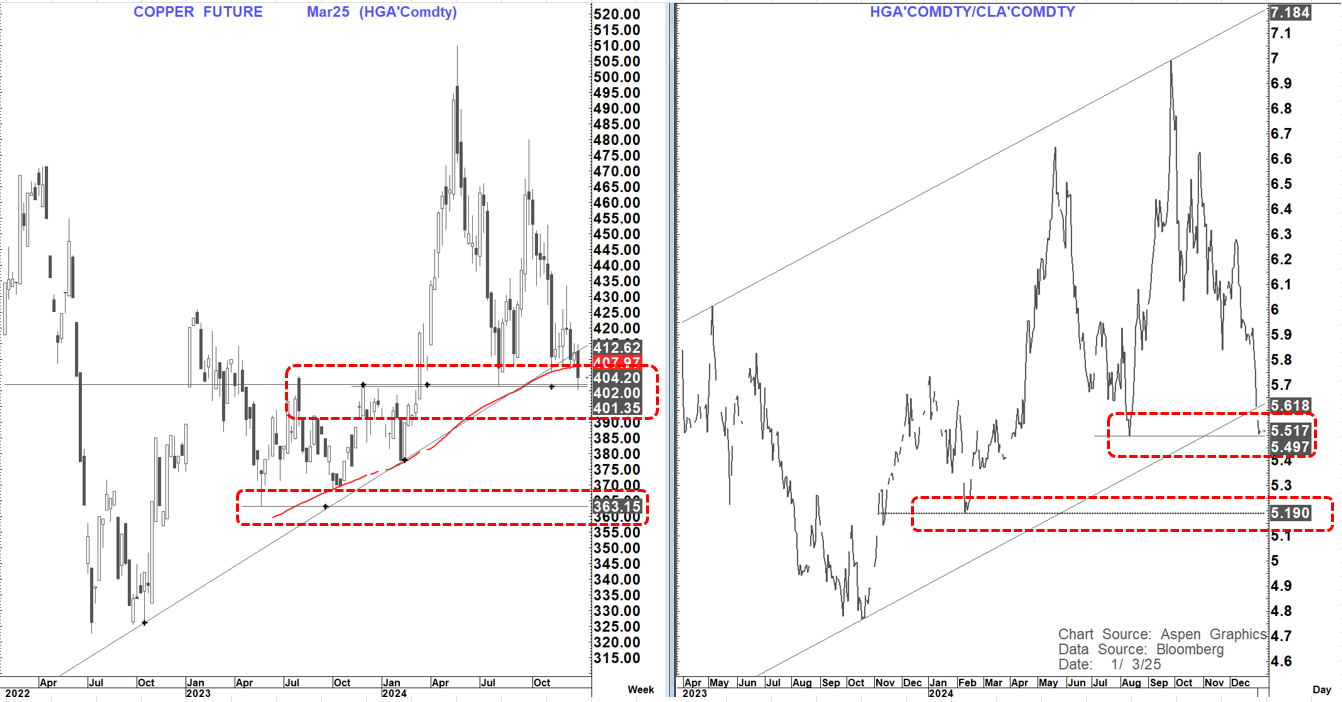
The fact that Copper continues to struggle to rally off this $400 level (and will look very susceptible if that goes) and the Copper/Crude ratio is falling further supports the notion that the Oil move is not coming from a perceived positive demand backdrop.
The other very interesting chart is Gold.
A close today, if seen, above $2,639 would be both a bullish outside week as well as an acceleration point on a short-term 76.4% pullback. Such a close would suggest that we could go back to test resistance at $2,721 to $2,726 if not all the way back to the highs at $2,790.
Not surprisingly all of the above results in a very bullish looking Gold-EURO chart. We will have a bullish outside week on a close over EUR 2,535 with a double bottom above EUR 2,595 that would suggest at least EUR 2,700
In reality the present pattern looks like a consolidation similar to that seen in Feb and July 2024 both of which gave way to much higher levels- both with moves that saw EURUSD move much lower