There is a lot going on this morning across markets, some aspects of which I covered in my weekend diary piece Diary Week 75: Fed Between A Rock And A Hard Place
So, a quick synopsis of what to look at as we start the week.
Equities
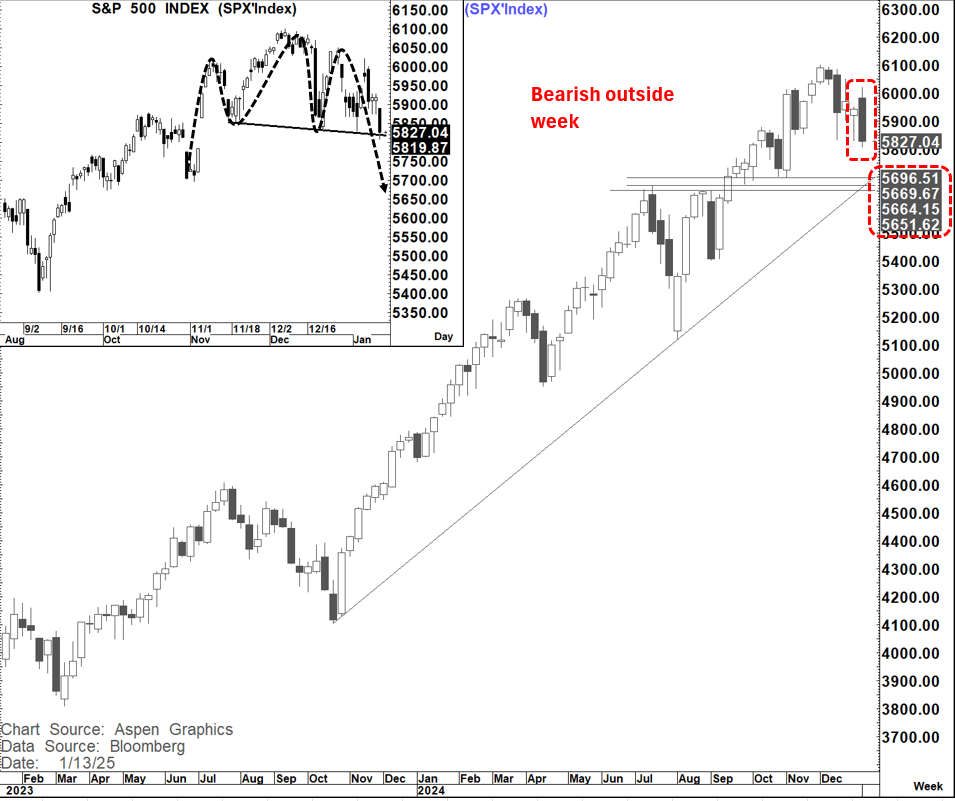
We posted a number of bearish outside weeks (Higher high than prior week, lower low and close below prior week's low) on US equity markets last week including the SPX, DJIA, Russell 2000, DJ Comp Index, the Regional Banks Index (KRX). the KBW bank index (BKX). While we did not get a weekly reversal on the NASDAQ indices the overall pattern looks very similar.
Using the SPX as a benchmark this reversal would suggest continued losses towards at least 5,650 to 5,700. However, as i noted in my weekend piece I do not think a fall of that magnitude moves the needle for the Fed and we would likely need to be heading closer to a bear market, which means close to 4,880
On the daily chart a further close below 5,820, if seen, would target a move to 5,660
Rates
Again, as noted in the weekend piece the bond market remains unequivocally bearish now until something breaks. While recent repricing of the Fed has allowed the US 2-year yield to lead the way causing curve flattening I think that is as much as anything a function of positioning. Unless the market moves to a page of believing that the next Fed move is a hike and that we are not in a pause/hold it will be difficult for the 2-year yield to sustain above the upper band of the Fed Funds rate at 4.5%. Thereby we should at some not-too-distant point see curve steepening re-emerge after the cleanout.
The US 30-year yield chart remains the one I am most focused on. While a move back to the trend highs at 5.18% the ultimate target is closer to 5.75% while on the 2's 30's curve the target over time remains for a move above +120 bp's
The US 10-year yield has broken the 4.74% level and next targets are now 4.885% and then the trend high at 5.02%
The German 10-year yield has completed a double bottom at 2.5% which suggests it could ultimately move towards 3%
In the UK we remain close to trend highs in 10- and 30-year yields with no big levels or any notable signs of respite in sight.
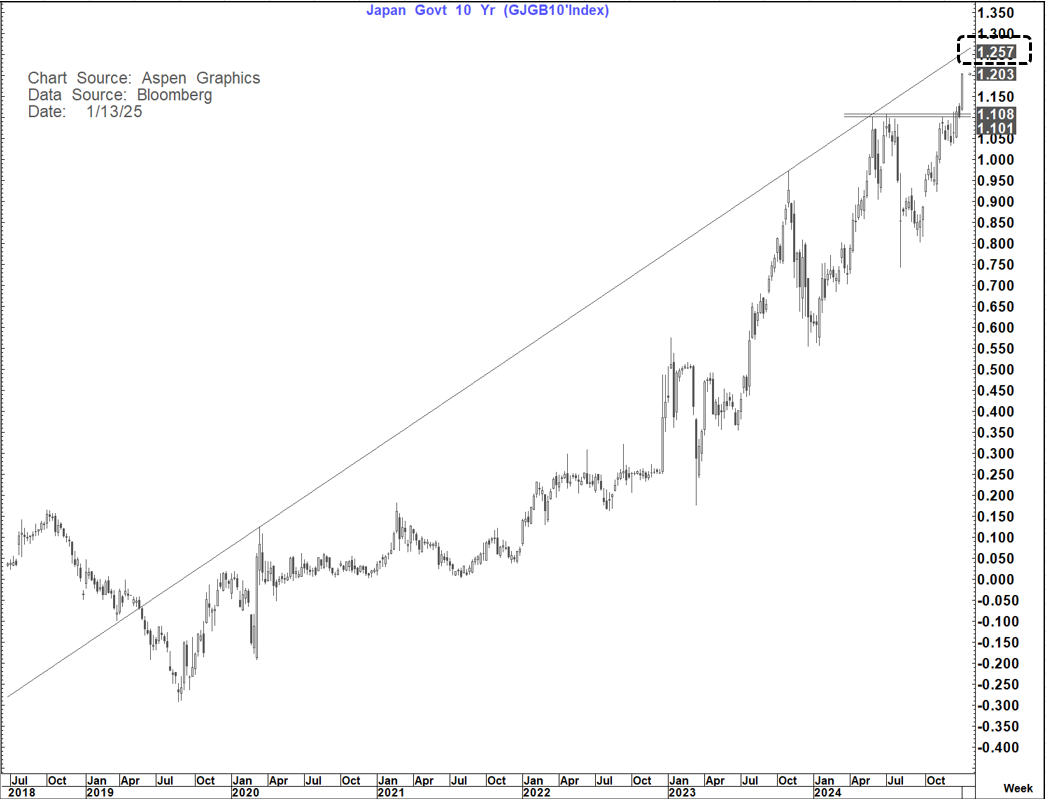
Even in Japan we have seen a surge in the 10-year yield and a move to at least 1.25% looks imminent
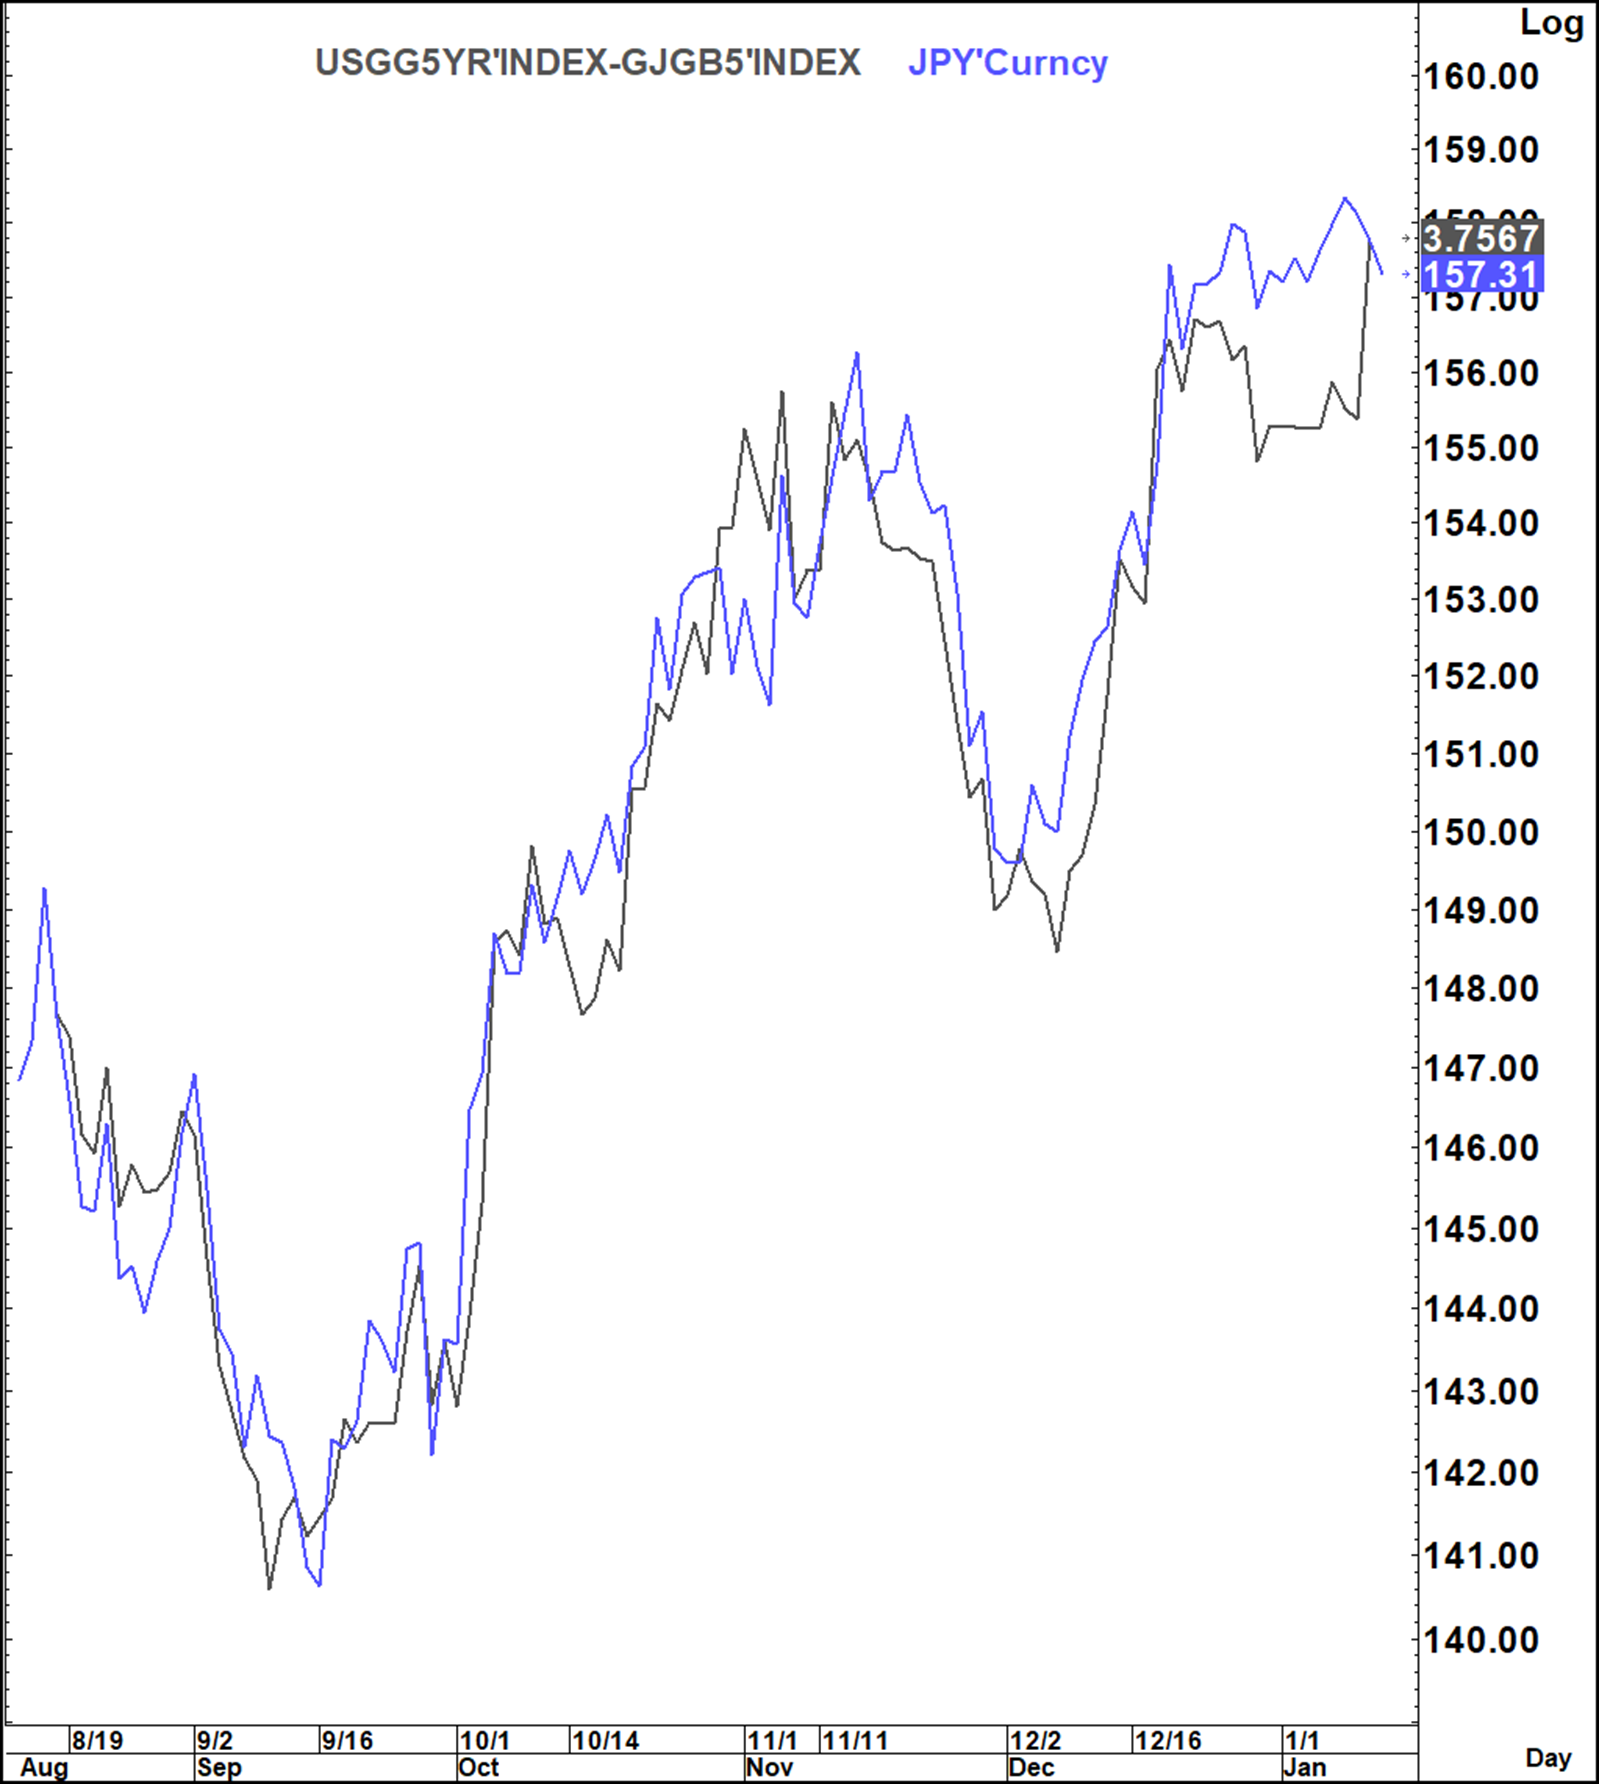
While the US-Japan 5-year yield spread has moved higher we had previously had a disconnect here so USDJPY and the spread are now once again converged.
While higher yields normally mean a higher USDJPY this has not happened because of the prior disconnect. Even now with yields higher and if equities continue to fall the risk off backdrop should suggest that USDJPY will still not lead the USD move and JPY crosses should continue to fall
As a consequence, while a higher USD still remains the path of least resistance (EURUSD has support at .9950-1.000 and then .96 to .97, GBPUSD looks set for 1.20 and beyond, the DXY still looks like it could head towards at least 114.75 with interim resistance at 111.20) JPY crosses lower still looks a good trade. In that respect one of my favourite charts is GBPJPY
The move lower in GBPJPY started with a bearish outside week and the target is horizontal support at 188.10. However, that is also a potential double top neckline with a target around 178 with good support at 180.10-181.30
Commodities
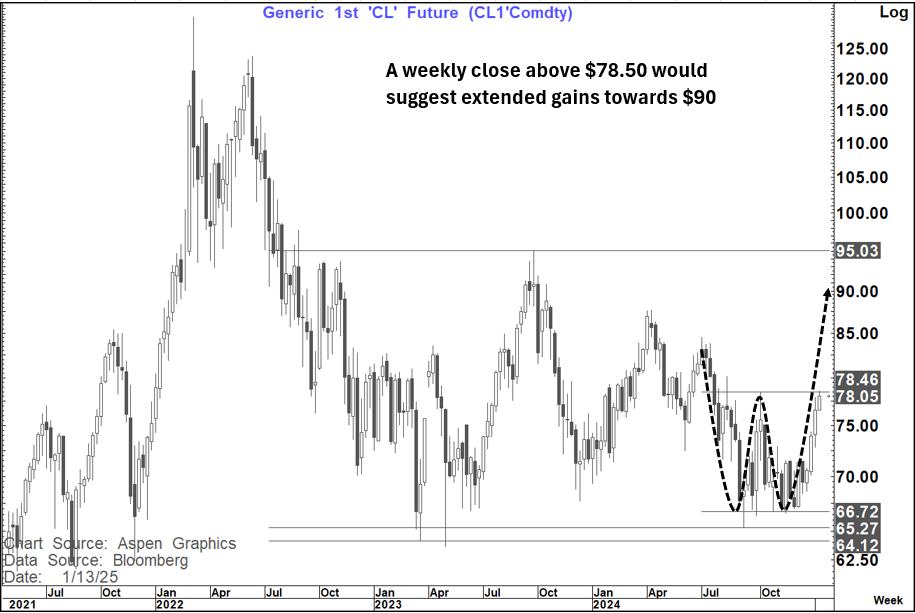
The main chart of focus here is WTI which has already completed two double bottoms and met the targets of $76 and $78.50-$79 respective. Now it is at the most important level. The $78.50 is a potentially 3rd and most aggressive double bottom neckline. This is more medium term and a weekly close above is probably needed to confirm the break.
Such a break if seen, suggests extended gains towards $90. this has 2 major implications:
The move is fast and likely to have a fairly quick move into headline inflation complicating things for the Fed as noted in my weekend piece. Over time an extended move at pace could cause problems for the economy and discretionary spending as we saw in 2008 and to a lesser extent 2018. However, for now it is the inflation dynamic that is likely front and center.
The present bias of the market is to send yields higher when Oil goes higher so this literally "adds fuel" to the present yield move.
IF WTI was to break $95 (Not at this point a base case) that would be a very big deal as that would be the final huge double bottom that would target $125
I still like Gold overall but for now prefer against crosses and in particular against GBP given USD and yield moves at present
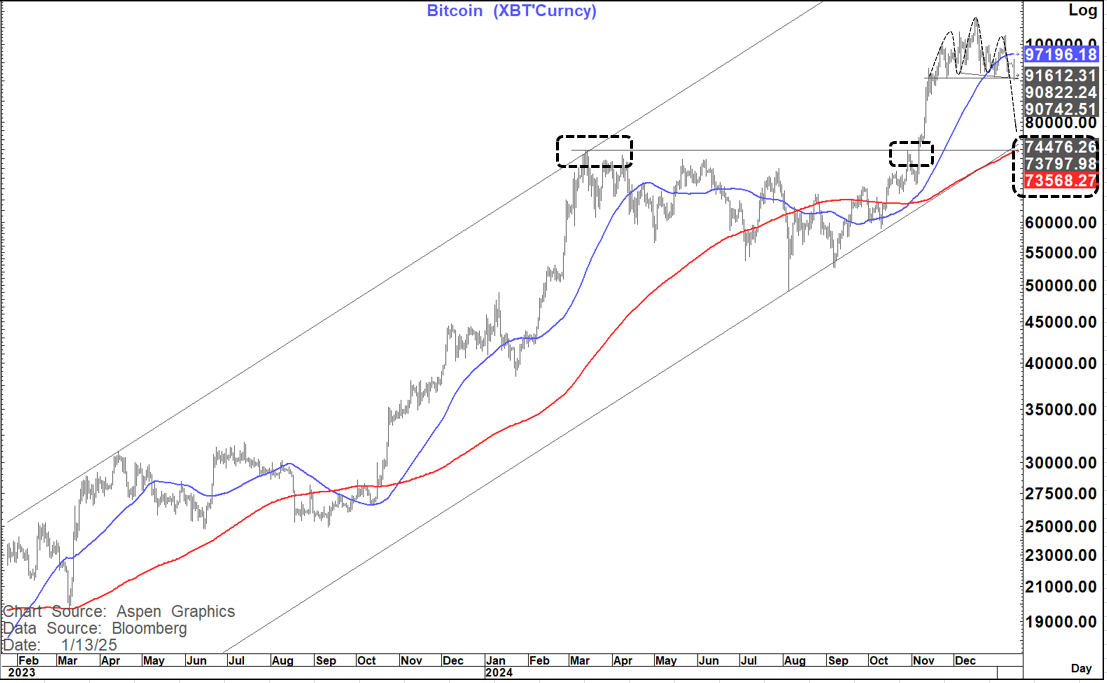
XBT is on the edge. It is back to trading as a risk asset and if equities continue lower it will likely remain susceptible as do all "owned" trades in a risk off environment.
The pattern here is very like the S&P with a possible head and shoulders top forming. A decisive break below $90,740 to $90,820 if seen, would suggest a danger of an "ugly" position squeeze down towards $74k