There are a number of US Equity market charts that look "shaky" but the leader in the prize for the "Ugly Duckling" chart is clearly the SOX (Philadelphia Semiconductor Index).
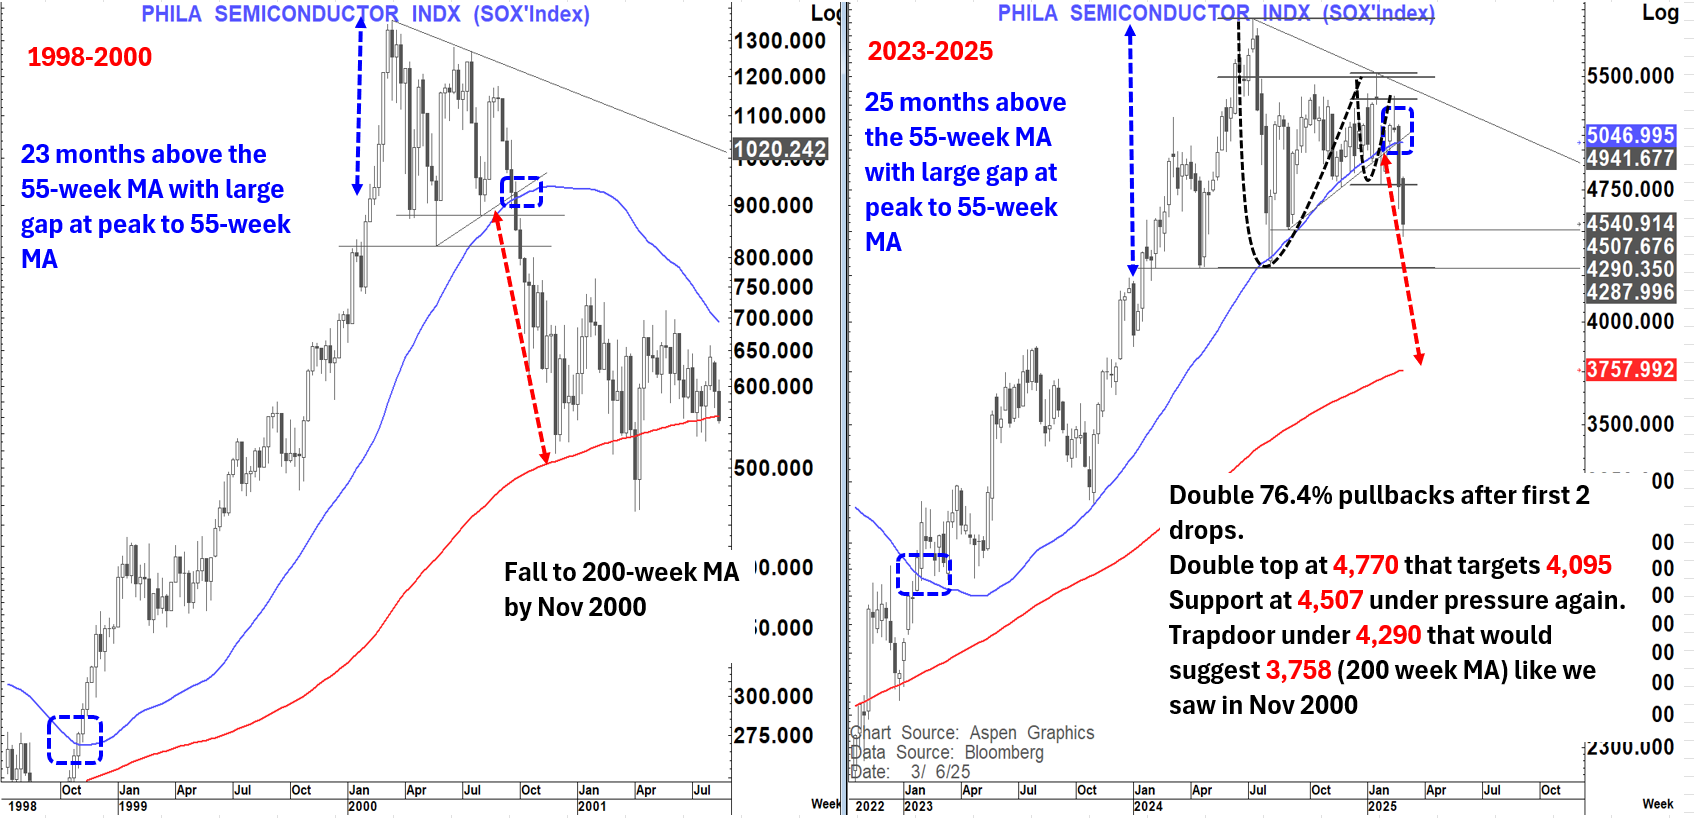
Below you see today's chart (2023-2025) with a comparison to the same index in 1998-2000.
It has been above the 55-Week MA on a closing basis for 25 months until last week.
It was very stretched to the 55-week MA at its peak
Momentum opened up a very wide 55-200-week MA gap.
After its first fall in July, 2024 it rallied back to the 76.4% retracement level by January this year. It then had a smaller fall which then also retraced to the 76.4% level in February.
It then completed a double top last week with the close below 4,770 that targets 4,095
It is now testing interim support again at 4,507.
The pivotal support off which the major 76.4% correction took place is 4,290 and a weekly close below there combined with the 55-week MA break would suggest at least a fall to the 200-week MA presently at 3,758