
To me the picture of US yields going lower is very clear. But how much lower?
Below I articulate the levels focusing on the good (short-term concern) the bad (more serious) and the ugly (most serious) across the curve.
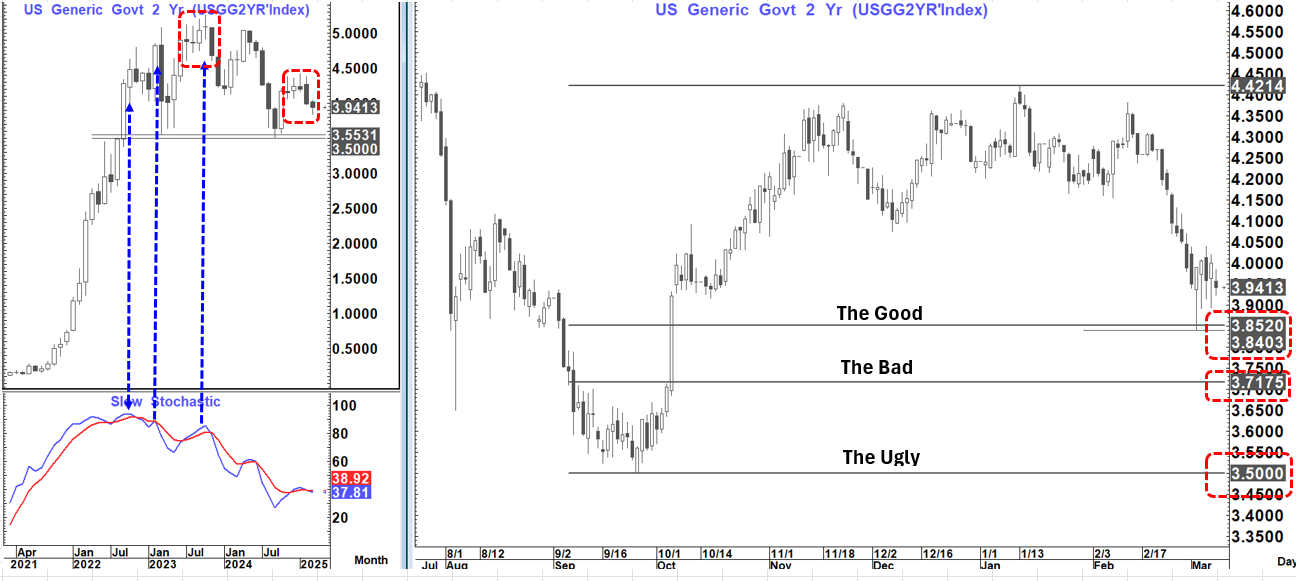
US 2-year yield.
The big turn on the US 2-year yield came in Nov 2023 with the triple momentum divergence and evening star formations on the monthly chart. We have never been higher in yield since and that still suggests a trend high was put in.
Last month we once again completed an evening star formation on the monthly chart suggesting a danger that the target here is "The Ugly"
What are the downside levels to watch?
The Good: The good is that we only re-test the 3.84-3.85% area and put in a double bottom- not really that far away
The Bad: A break below the 3.84-3.85% area opens up for extended losses towards the 76.4% pullback at 3.72%. For this to happen the market has to start thinking that the Fed is going to capitulate on their- "No rush" view and likely needs economic and/or equity market stress to continue.
The Ugly: We go all the way back to the Sept 2024 low at 3.50%. To go here likely means the market has become convinced that the Fed is behind the curve and will likely have to do more and quicker than expected.
Remember that
1. The basic rule of thumb that has served well for decades is that the trend low or high in the 2-year yield is likely pretty close to where the trend low or high will be on the Fed Funds rate. (Trend high was 4.42% in 2023 with trend low at 10 bp's in 2021). So far that still argues a Fed funds rate of 3.5%
2. I have constantly referred to the 17-year US economic cycle that has seen significant downturn in the economy and/or markets.
1972-1974: Banking and housing stress, economic downturn and S&P drops 48% over 23 months in 1973-1974.
1989-1991: Housing/savings and loan and economic downturn. Downturn in SPX of 20% over 3 months in 1990
2006-2008: GFC- Downturn in everything. SPX falls 58% over 17 months in 2008-2009
In addition, I have also noted that there are strong similarities in how both the SOX and NDX are trading compared to Sept-Oct 2000. Leaving out the the falls generated in 2001 into and post 9/11 the SPX still fell 30% over 13 months in 2000-2001
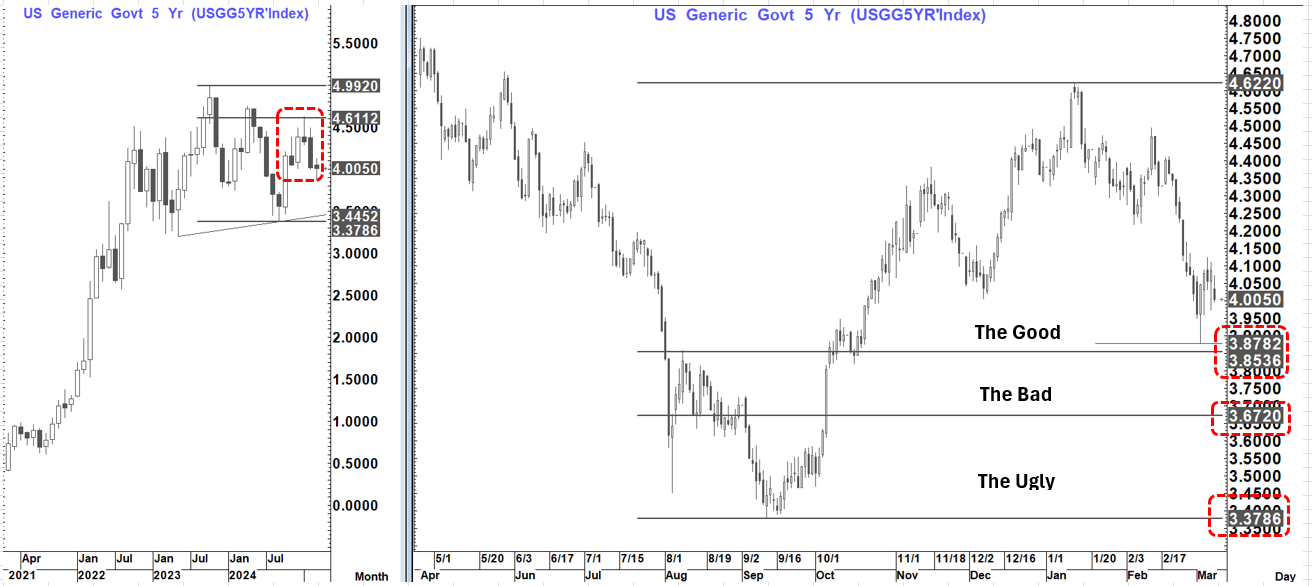
US 5-year yield
The close last month shows a clear evening star formation on the monthly chart that suggests we may go all the way back to the trend lows at 3.38%.
What are the downside levels to watch?
The Good: The good is that we only re-test the 3.85-3.88% area and put in a double bottom- not really that far away
The Bad: A break below the 3.85-3.88% area opens up for extended losses towards the 76.4% pullback at 3.67%.
The Ugly: we go all the way back to the Sept 2024 low at 3.38%.
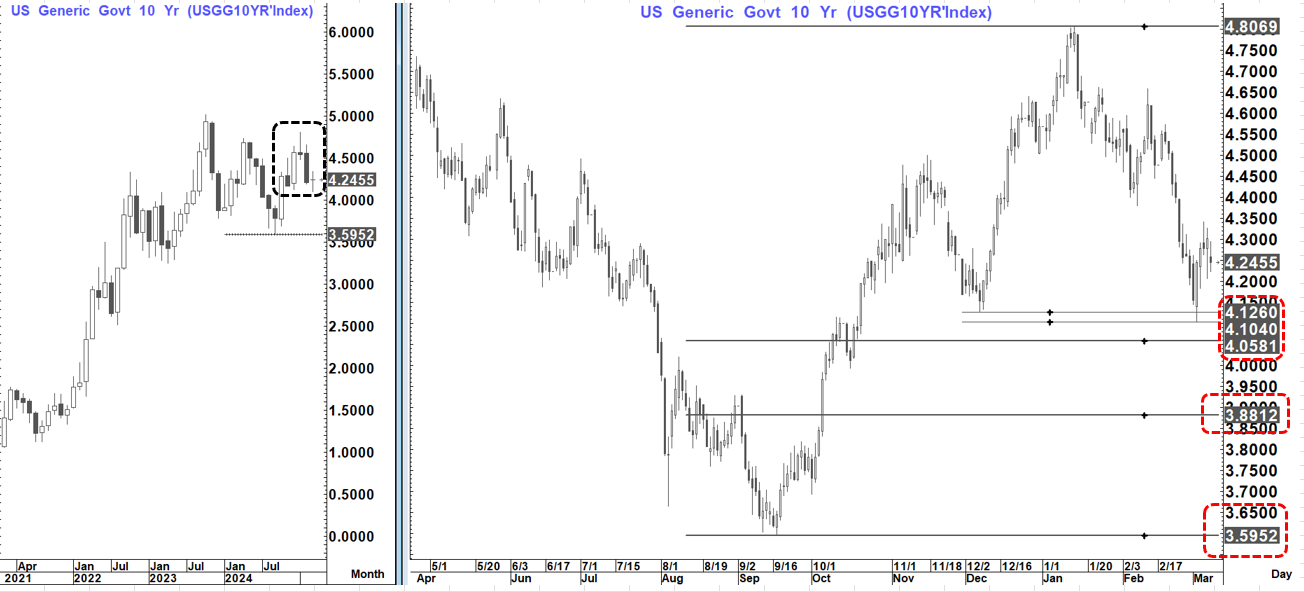
US 10-year yield
The close last month shows a clear evening star formation on the monthly chart that suggests we may go all the way back to the trend lows at 3.6%.
What are the downside levels to watch?
The Good: The good is that we only re-test the 4.10-4.13%% area and put in a double bottom- not really that far away...maybe extend to the 61.8% pullback at 4.06%
The Bad: A break below the 4.06-4.13% area opens up for extended losses towards the 76.4% pullback at 3.88%.
The Ugly: we go all the way back to the Sept 2024 low at 3.60%.
Right now, I am not sure which is the Spaghetti western- the movie or the present backdrop.