Finally, the moment is almost upon us. and we have less than 24-hours to the all-awaited August 2024 jobs report
What a change from only weeks ago.
We now have everybody focused on this - laser like. There is now almost unanimity that it will shape what the Fed does in 13 Days' time (Unlucky for them?). All the grids are out over the last 24 hours plotting the 25 scenario, the 50 scenario with a little wing also plotting the ZERO scenario.
As we have seen many times before the landscape has again moved markedly in a very short space of time.
It is clear that for now the Fed has completely shifted back to the Employment side of its mandate.
The danger, of course, is that any one number can be completely random and/or revised.
We only need to look at the disappearance of 818k jobs on the BLS 1-year revision in an instant (or should I say 32 minutes), with a little help from the Birth Death ratio (Or as I call it the wallpaper pattern) to realise that.
Notwithstanding that there are some very good reasons to suspect a weak number tomorrow . Let's articulate some of them.
1. JOLTS. Yesterday JOLTS just printed a slumping 7.673mm number down from a revised 7.910mm number (originally 8.184mm). That makes it a new low in this series and the lowest print since Jan 2021.
Here's the thing though.
When we look back to that period into Feb 2021 unemployment had collapsed from a peak of 14.8% in April 2020 to 6.2% in Feb 2021. Over the same period Jolts had risen from 5.046mm to 7.818mm and the JOLTS/Total unemployed ratio had gone from 0.2 up to 0.78 (enroute to a move over 2 by March 2022). So, the last time we saw this number was an environment of strong job growth / strong payrolls/ and a rising JOLTS/Unemployed ratio.
This time we are seeing this number print as JOLTS have collapsed 37% from their 12.182mm March 2022 peak. At the same time the unemployment rate has risen from 3.4% to 4.3% and the JOLTS/Employment ratio is now down to 1.07.
To the extent that this is a good indicator it would suggest a danger of both a downside miss on NFP and given the prior month revision lower in JOLTS possibly a downside revision in the prior month NFP number also.
2. In the last 10 years the August initial number has printed below the July initial number 8 times. With regard to the 2 other occasions, we saw an exactly equal number (2023) and a higher number by +44 k (2018). It would need not only to be only the 2nd time in 11 years to beat the July print but to meet expectations (165k- although whisper likely lower now) it would need to beat last month's print by 51k something that has never happened in the last Decade.
3. The Birth Death Ratio is going to be significantly lower than last month. Why? Because it is "Fake news" . It is a made-up statistical model number which likely was heavily responsible for mis-stating payrolls from April 203 to March 2024 by on average 68 k a month. Last month that number was 246k. This month it will be in the 93-111k range. Why? Because the last 10 numbers in August have been 103k, 109k, 142k, 154k, 93k, 104k, 103k, 106k, 111k, 104k. For some reason 2020 and 2021 are an "anomaly" and a little bit 2019. Otherwise, the wallpaper range has been 103-111k. So, the seasonal adjustment will be low and if not in this range likely lower if they adjust for what has clearly been an incorrect statistical adjustment.
4. ADP was pretty spot on last month with its 122k prediction although we have to recognise that that relationship has been spotty. Although we could ask is that because ADP has been so wrong of that the NFP numbers are flawed? ADP just printed a 99k forecast today.
4. So far this year the initial NFP print has been revised down (first revision) 5 out of 6 times by on average 44k albeit the 124k revision for January skews the number a little. Without that the average is more like 24k. The one revision higher was by 12k.
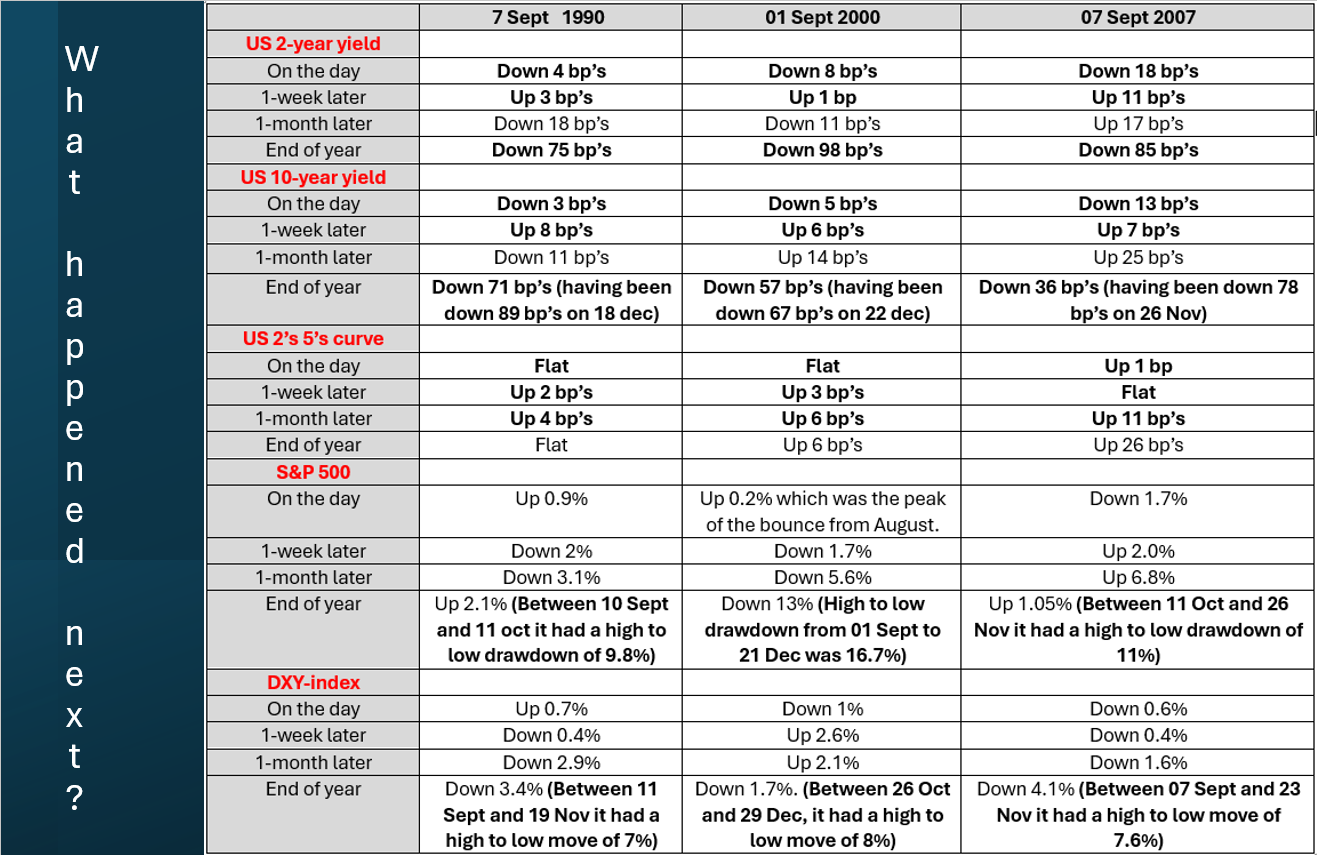
And then there are my three historical overlays/comparisons from 1990,2000 and 2007.
1990: We have no revision data a from back then. July printed minus 35k and August followed with minus 212k. The unemployment rate went from 5.5% in July to 5.7% in August. This is the least compelling of the 3 periods compared to today. The participation rate in August was 66.5%
2000: The initial number in July was minus 108k. The revision improved to minus 51k but August printed minus 105k. the unemployment rate rose to 4.1% from 4.0%. The participation rate in August was 66.9%
2007: The initial number in July was +92k and that was revised down to +68k and August printed minus 4k. The July unemployment rate was 4.6% and printed unchanged in August. The participation rate in August was 65.8%
I note the participation rate in those periods to emphasise that comparing today's 4.3% unemployment rate to those periods is a little apple versus oranges comparison. The low unemployment rate gets "flattered" by a lower participation rate. I also have a sneaking feeling (take it for what it is worth) that as the "well is running dry" for consumers out there we may start see people come back to the labor force who had exited. If this happens when job openings are dropping it will likely boost the unemployment rate.
So "pedal to the metal" what is the bottom line. While this is obviously an exercise in "masochism" I will do it anyway.
I think we will likely get a downside miss on payrolls and a downside revision. I doubt the number will be negative, (like it was in 1990, 2000 and 2007) but I think something like +50k is not outside the realm of possibility.
I think there is a possibility of a pickup in the participation rate which could feed into another rise in the unemployment rate to 4.4% (consensus is the other way at 4.2%)
IF we get a scenario similar to the above then expect yields to fall sharply led by the 2-year yield - probably testing the year's low at 3.65% (depending on where we are going in) and below there the pivotal low from March 2023 at 3.55%
At the margin I think Equities would likely treat bad news as bad news (rather than positively respond to lower yields) and move lower on the day
I would expect the USD to weaken and Gold to rally.
I would expect the Fed to replicate what they did on 18th Sept, 2007 and cut rates by 50 bp's.
Below I reattach the Grid showing how markets performed after the weak readings in 1990,2000 and 2007. If we get a weak reading tomorrow, then I think this could be a good road map of what to expect.