Wishing everybody and their families a very Happy New Year and hopefully a healthy and wealthy 2025.
It is the last trading day of 2024, and what a year it has been. Many markets have moved in many ways this year but today I look to have one final focus on the Bond Market in 2024.
In that respect a quick look at the US 2- and 30-year yield charts is today's focus with a quick refence also to the USD and Equity markets
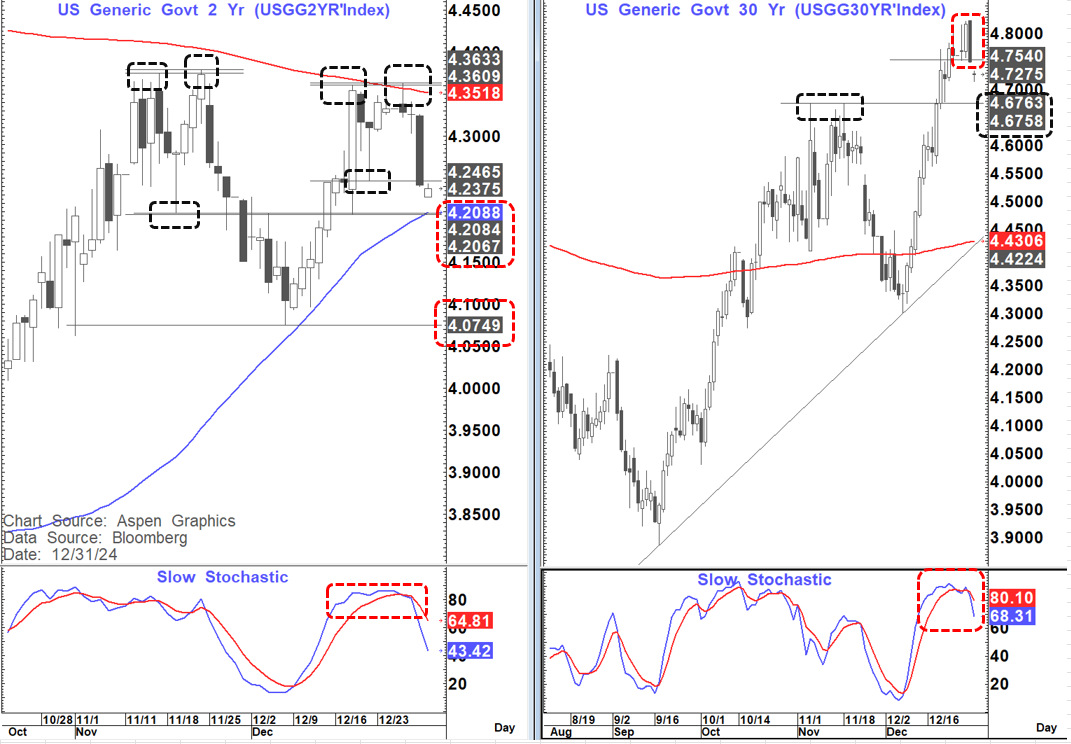
US 2-year yield.
While the bias is that this year should trade in pause mode (Fed in a 4.25 to 4.50% range overall) we can obviously see some exceptions to that rule in short-term trading.
In fact, we saw that to some extend yesterday as the 2-year yield closed below 4.25% thereby completing a short-term double top. This suggests a danger that we can re-test the nearby support and 55-day moving average at 4.21%. Such a move does not really change anything in the broad-based overview noted above...BUT SOME CAVEATS
The close below 4.25% also completes a clear double top that suggests a move towards 4.14%- materially below the Fed Funds base at 4.25%, That 4.21% level was also the neckline of a double top that formed on 29 November that targeted a move to 4.05% and we in fact moved to 4.075%- 5 trading days later.
This double top targets 4.14% which would take us below that same support area and open up the danger of a move towards that prior low at 4.075%.
IF, we were to break that level we would then have an even bigger double top that would target as low as 3.75%. For that to happen now would suggest we would likely have to be seeing something happening that is questioning the base case of a Fed now on pause (The equity market being one of the things to think about but not the only thing)
This is not the base case at this point, but these pivotal levels need to be watched as we head into 2025.
The other chart I am watching is the US 30-year yield chart.
Yesterday it completed an outside day at the high of the trend and broke through support at 4.75% opening up the way for a test of the 4.67-4.68% area. If that were to give way there are some good short-term levels at 4.55-4.57% but the main support area is down at around 4.41% to 4.43% . that, if seen, would be a move similar to that seen between mid-November and early December.
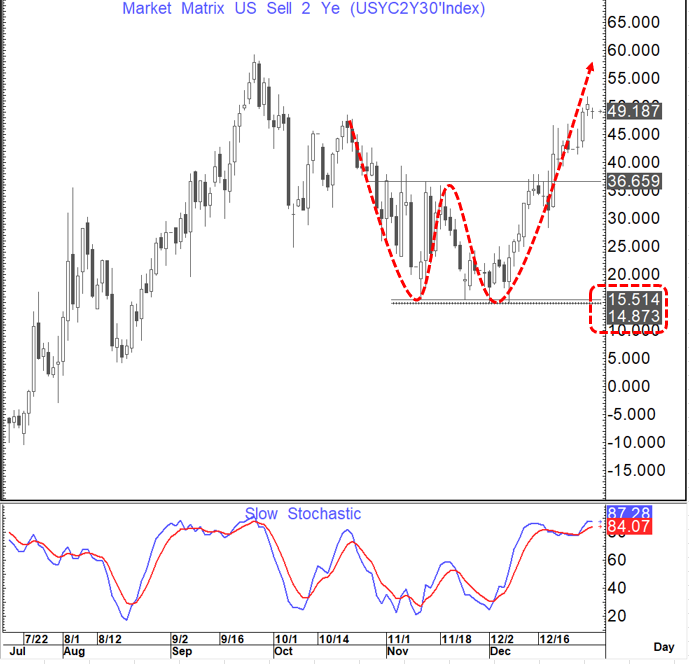
On both charts we also see daily momentum turning lower and in the case of the 30-year some momentum divergence at the peak. How each of these individual charts perform is also likely instrumental in what the US 2's 30's curve does near term . In the move lower in yields in November-December the 30-year yield led the way leading to the curve flattening 20 bp's. A similar move if seen here would open up the possibility of a re-test of the break higher pivot at 36 bp's . As yet the double bottom target of +59 bp's again has not quite been reached
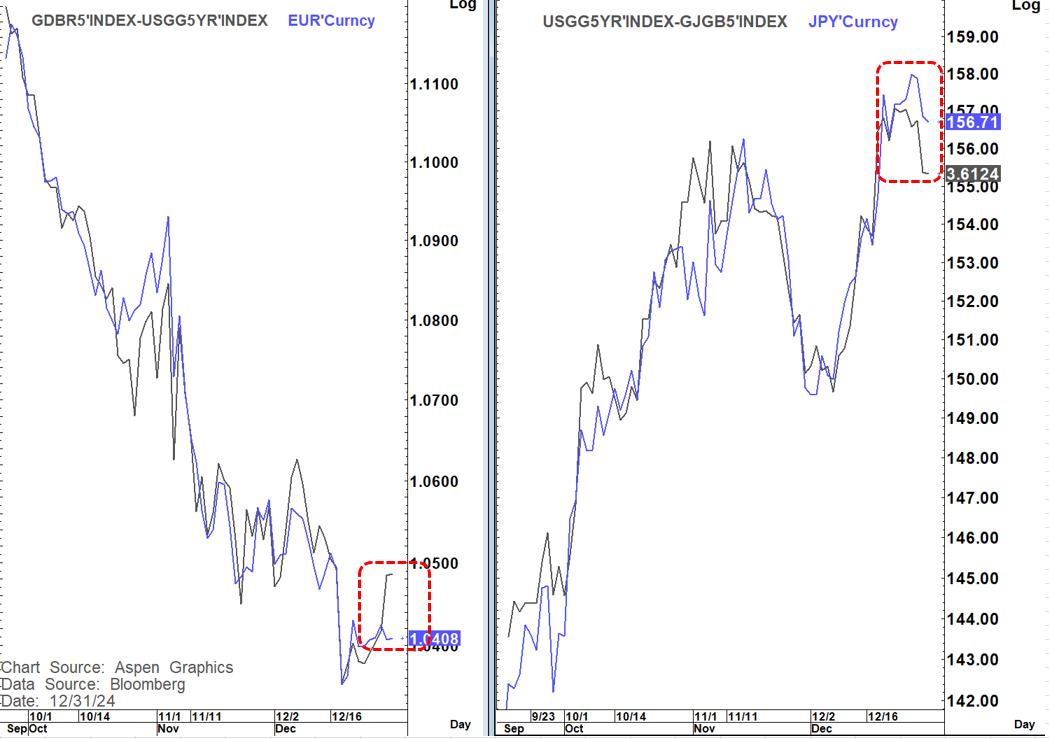
This yield development, if it materialises also likely has short-term USD implications. The period on the curve to watch most in that respect is the US 5-year yield but if we see falls as noted above in the 2- and 30-year yields then 5's will be falling also.
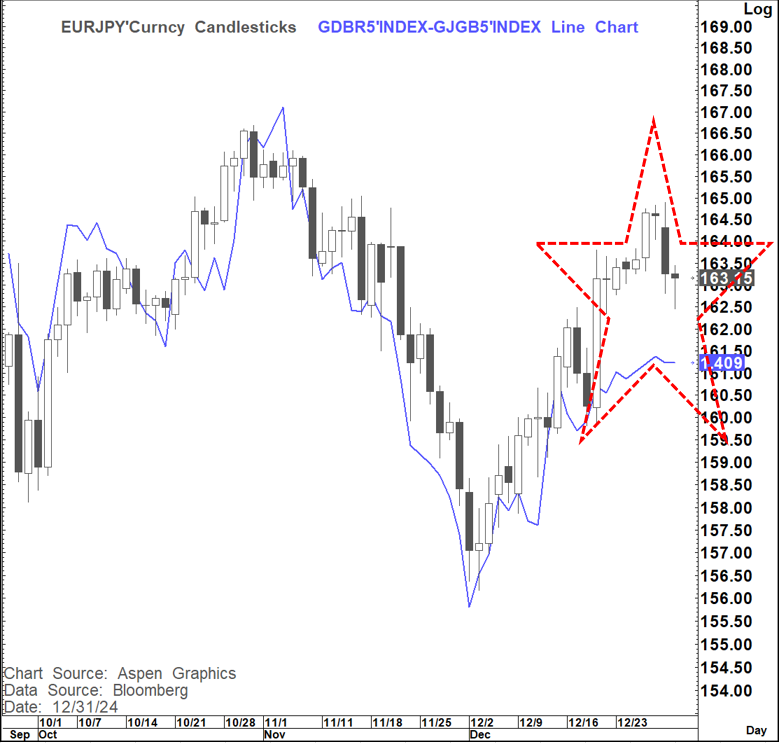
We can see that relationship very clearly in the chart below and we can also see that the EURUSD and USDJPY reactions to this recent move have been quite muted. In fact, the yield moves suggest that EURUSD should already be closer to 1.0500 and USDJPY to 155. If this relationship is intact (and as yet there is no reason to suspect that it is not) then either the USD should fall further near-term or the yield move should reverse.
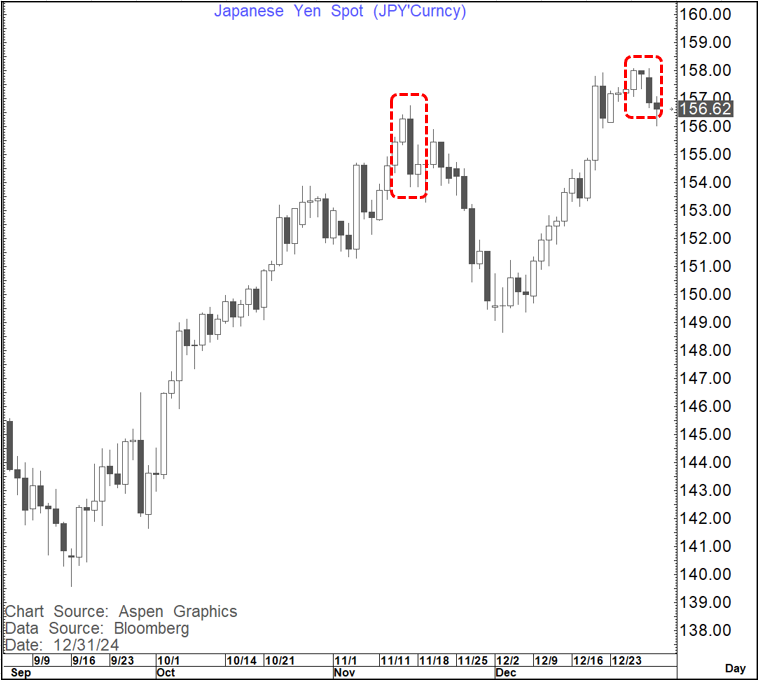
Yesterday we saw a bearish outside day in USDJPY very similar to what we saw on 15 Nov as yields turned lower. After a few days of chop, we ultimately saw a much lower USDJPY into early December in line with the yield and yield spread move.
The JPY was the only component of the DXY that saw this bearish reversal as it was on 15th December suggesting that USDJPY is likely the biggest G10 FX reaction lo look for If these yields fall further and therefore by definition JPY crosses likely move lower. This is even more likely if Equities also continue to struggle.
In that respect we also saw an aggressive bearish outside day in EURJPY (as we did on 15th Nov) and we see a big disconnect in those spreads
Yesterday we also saw bearish outside days in GBPJPY, and SEKJPY but not CHFJPY or CADJPY
Bottom line these yields need to be watched carefully in the short-term as the charts suggest a danger that we can go lower still.
IF the 2-year yield decisively regains 4.25% and the 30-year 4.75% then this picture would moderate somewhat.
The USD and in particular USDJPY is likely to follow this path and IF equities start to struggle again then so likely will JPY crosses.
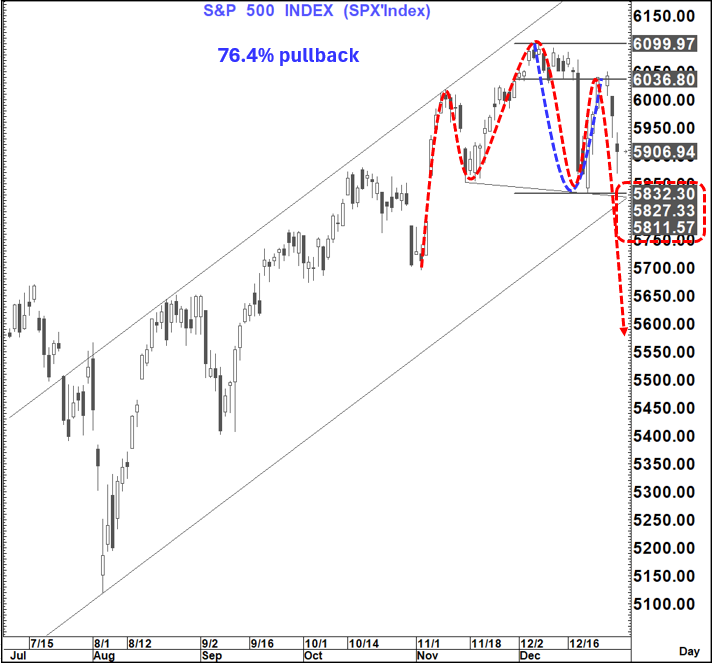
In that respect the S&P 500 chart is worth watching. The recent bounce turned off the 76.4% retracement level and IF we start to fall again and IF we break the 5,812-5,832-support area then a move as low as 5,570 would be the target (High to low of nearly 9%)