*****I think this may be the most important note I have published all year****
Obviously, we cannot remember it yet, but that all important 6th September date is almost upon us and the burning question is - what does the employment report hold.
I have been very vocal about the importance of the (Deteriorating) Employment picture with a particular emphasis on the 6th September print (August data)
So let me take one step back and once again articulate why I feel this is so important.
There are 3 overlays/analogs I have been very focused on.
1990: While very much Japan focused (USDJPY collapsing from above 160, Nikkei from 40k, BOJ tightening, Fed easing etc.) there is also very much a US component to this period including a recession and housing/banking stress. Having been on pause since late 1989 when the Fed had cut rates 150 bp's they re-started the cutting cycle in July 1990 cutting another 125 bp's by year end and ultimately another 400 bp's into 1992.
2000: Has been very much the focus when it comes to the Equity market path (DotCom bubble), the Fed (raising rates to 6.5% and real yields to 400 bp's after initially easing in 1998 on the back of a Contagion). A financial contagion (Russia/Asia/LTCM). The Fed was stubborn in this election year and did not make its first cut until January 2001. Between January and May 2001, they cut five times with every cut being 50 bp's. they subsequently cut a further 300 bp's into 2003
2007: This is the period that the bond market (In particular the 2-year yield) has been trading almost identically to. Yes, further down the line this turned into the GFC but at this point in the cycle that was not readily apparent, and the Fed had not even cut rates yet. The first cut came from the Fed on 18th Sept 2007 (Same date as this year's meeting) and was 50 bp's followed by two 25 bp cuts by year end. They subsequently cut another 400 bp's into 2008.
In all these periods the Employment side of the dual mandate was critical.
1990: By July 1990 the unemployment rate had risen to 5.5% from a cycle low of 5.2%. It then rose further to 5.7% in August
2000: By July 2000 the unemployment rate had risen to 4.0% from a cycle low of 3.9%. It then rose further to 4.1% in August
2007: By July 2007 the unemployment rate had risen to 4.6% from a cycle low of4.4%. It then also printed 4.6% in August
2024: By July 2024 the unemployment rate has risen to 4.3% from a cycle low of 3.4%. August is still a work in progress
In the prior 3 instances the average unemployment rate by July was 4.7% which was on average 0.2% off the trend low. This time while the unemployment rate is below the average of the 3-periods at 4.3% it has already risen 0.9% from the cycle low so the uptrend is much more advanced.
In addition, the 2000 and 2007 periods are much more in focus for me in terms of building blocks, Fed policy, Equity and Bond markets etc. therefore it is interesting that the average unemployment rate in July of these years was exactly 4.3% albeit with an average rises of just 0.15% from the cycle low.
Another interesting point is the demographics at play which clearly flatter how healthy this 4.3% unemployment rate is when we look at relative labor force participation rates.
1990- 66.5%
2000- 66.9%
2007- 66%
2024- 62.7%
But what I am most focused on for next week is Non-Farm payrolls.
That is not because it is the most important indicator- it is not. The recent revisions for the period April 2023 to March 2024 of minus 818k clearly show this and in particular how the Birth-death ratio component will be completely flawed at turning points in the employment picture.
In addition, NFP measures jobs, not people employed and will paint a better picture than exists if for example people are financially stressed and take a 2nd or 3rd part-time job. Recent data also shows that the majority of the jobs now being created are part-time jobs with the underemployment rate (U6) now up to 7.8%.
There is a common denominator to all the NFP prints from August 1990, 2000, and 2007. (All numbers below are actual, not revised, prints)
1990: In August 1990 the print was minus 212k. To be fair that was not the first negative print as it printed minus 35k in July. Up until then the average print in 1990 had been about + 170k
2000: In August 2000 the print was minus 105k. Again, that was not the first negative print. July 2000 printed minus 108k. Up until then the average print in 2000 had been +238k.
2007: In August 2007 the print was minus 4k. That was the first negative print of the year. Up until then the average print in 2007 had been +122k. The initial print in July was +92k and that was revised (first revision) lower to +68 k.
2024: We are about to see the August print. Up until now the average print this year has been +242k - quite similar to 2000 (Although that is unlikely to stand up to the BDR revisions next year) and 5 of the 6 numbers into June have been revised lower this year by on average 44k.
It is clear that in all these prior periods the numbers posted in July-August were a significant pivot point in the backdrop and the feedback loop into monetary policy.
Do I think we will print a negative number next week? No not really.
Do I think we need to? No not really
With the path of deterioration in the Unemployment rate as well as other employment data (JOLTS, JOLTS/Unemployed ratio, Quits rate, ECI, rise in initial and continuing claims, part-time job dominance, Govt. jobs versus private sector, NFP revisions, quality of jobs created etc. etc.) all we need to see next week is a significant miss to expectations (+155k) and /or a rise in the unemployment rate and I think a 50 bp's cuts is immediately on the table for 18th September.
We have no survey for 1990 but in 2000 we had a downside miss by 82k and in 2007 a downside miss by 104k.
Today that would equate to seeing a number between +73k and +53k. That, in my opinion would be more than enough to put 50 bp's in play on 18th Sept this year just as it did on 18th Sept 2007.
If the number is solid (well above +100k) and unemployment steady, then 50 bp's on 18th Sept may be a high albeit not insurmountable bar. Even so, it is still clear that the "die is cast" and with base effects on inflation increasingly giving the Fed cover that the Employment side of their Dual mandate is now back in the ascendancy and will drive their decisions in the months ahead.
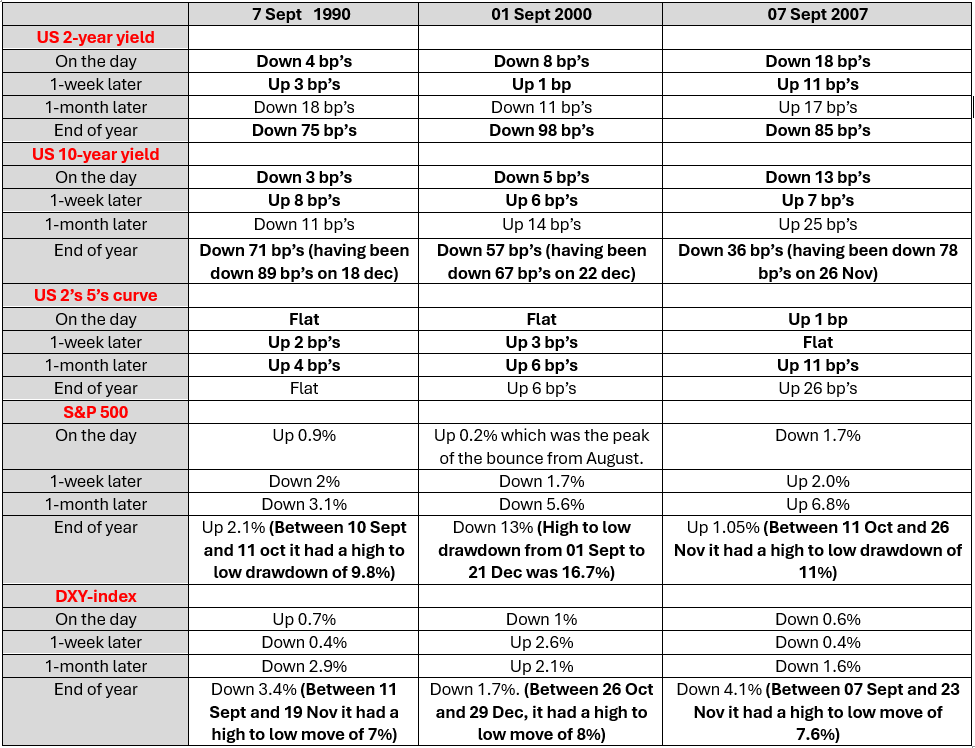
Finally, it is worth looking at what markets did in the period from the close on the day before this release in those prior years until year end. In that respect I will look at the US 2-year yield, US 10-year yield, US 2's 5's curve, SPX and the USD.
Observations:
US 2-year yield: Was lower in every instance on the day the data was released, bounced in the following week, was lower still 1-month later and was significantly lower by year end.
In 1990 TU1 had an up month in every month from Sept to Dec as it did in 2000. 2007 was choppier. It was up in Sept, Oct and Nov but down by a tiny amount (0.01%) in December
In 1990 the best up month of this four-month period was December. In 2000 it was also December and in 2007 it was November.
1990- Up 0.56% in December.
2000- Up 1.0%- in December- Best month of the year.
2007- Up 1.41% in November- Best month of the year
US 10-year yield: Was also lower in every instance on the day the data was released, bounced in the following week, was inconsistent/choppy over the following month but was also significantly lower by year end.
In 1990 TY1 had an up month in every month from Sept to Dec as it did in 2000. 2007 was choppier with a "barbell" type of pattern. It was up in Oct and Nov but down in sept and Dec.
In all 3 instances November was the best performing month of these 4 months.
1990- Up 2.32%- 2nd best month of year after May
2000- Up 2.16%- 2nd best month of the year after March
2007- Up 3.55%- Best month of the year
US 2's 5's curve
Had a clear upside bias in all periods. 1990 was much ado about nothing throughout the whole period, 2000 saw marginal steepening. Only 2007 saw significant steepening over this period.
S&P 500
No overall consistency at or post the data release. In all 3 periods it ended the year lower, but the bigger moves were inter-period drawdowns of pretty much double-digit percentage magnitude. The biggest of these was in 2000 and it also started the earliest. 2000 was the year the Fed refused to move and therefore the least likely outcome.
USD-index (DXY)
similar to the S&P it saw no overall consistency at or post the data release. In all 3 periods it ended the year lower, but the bigger moves were inter-period drawdowns of 7 to 8%, two of which were between early Sept and late Nov (1990 and 2007). 2000 came later and again probably because the Fed refused to capitulate and cut rates.
All of the above is based on the presumption that like in all those years the Employment data next week will be poor.
If that is not the case it does not necessarily change the big picture over time but would likely complicate these paths at least in the near term making the amount of time I have taken to write and the amount of time you have taken to read, this piece, time we will never get back.