What looks interesting this morning?
- German Yields have made some good breaks suggesting lower levels still.
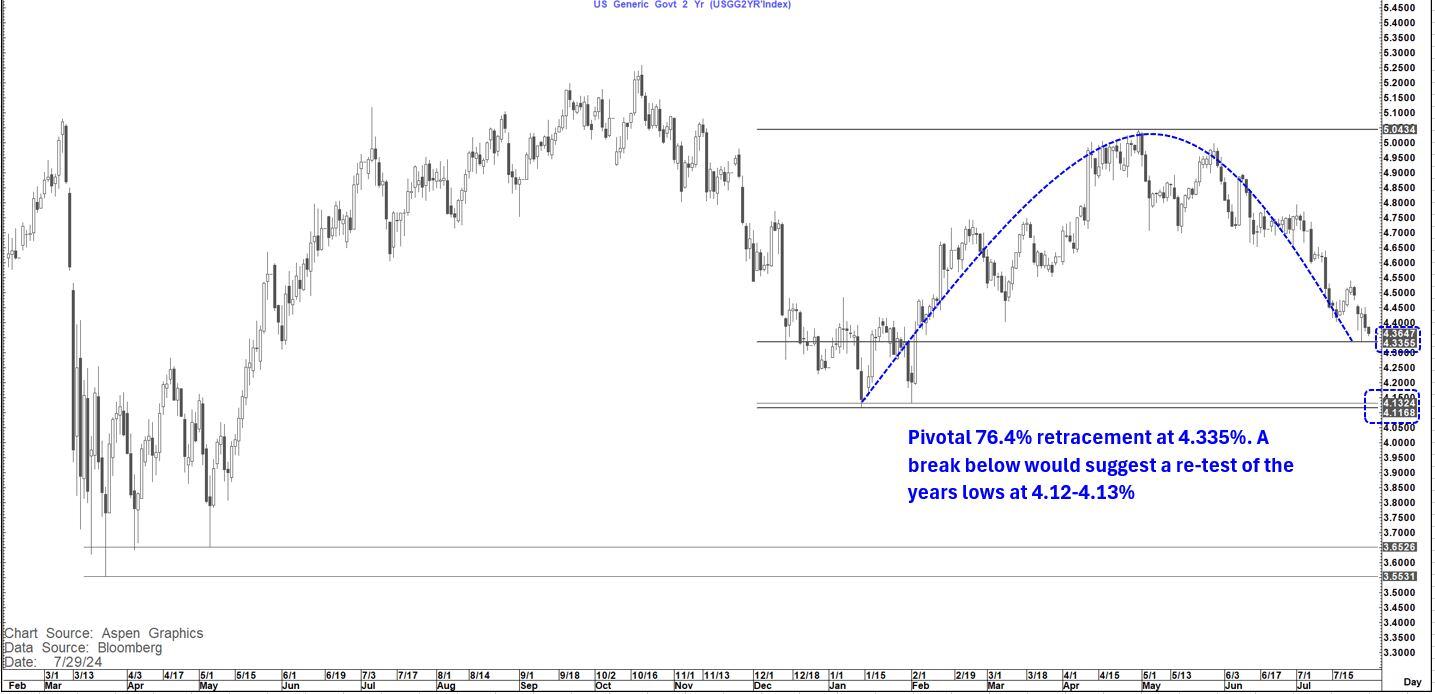
- US 2-year yield remains poised around an important pivot
- Bitcoin starting to look like a bull flag
- EURUSD looking shaky again
- China 2's 10's holds pivotal level
- Es1 looking more balanced now ....and more
German 2 Year yield remains decisively below the head and shoulders neckline at 2.70% continuing to suggest a move below 2.30% again
We have also completed a head and shoulders break on the German 5-year yield that suggests at least 1.95% and are close to good support on the German 10-year yield at 2.34%
The US 2-year yield remains "poised" above the pivotal 76.4% level at 4.335% (Low so far 4.338%). 76.4% retracement levels this year have been big both in terms of when they hold and when they break and with both the FOMC and Employment this week (as well as other decent data) I suspect this level will be no exception.
My bias remains that it will give way and open up for a move towards 4.1% and the traditional 140 bp's spread to Fed Funds ahead of the first cut in the cycle so that will be important to watch.
Historically when that has happened it has ended up being an aggressive cutting cycle.
Bitcoin has increasingly started to look like a bullish flag similar to that seen in March-October 2023
If we look at this setup on a linear measured move basis it does not suggest much more than a test of the flag top at $70,700. However, if we look at it on a log basis which is probably more relevant the suggestion is for a move more in the region of $110,000 between end of Q4,2024 and Q1, 2025.
Gold and Silver are once again also looking "perky" but we still need Gold at least above $2,432 and Silver above $28.57 to see a more constructive case building again.
EURUSD is once again approaching the converged 55 and 200-day MA's at 1.0817-21.
On the prior 2 times that it has done this and broken below (March and June) we have seen material losses in the days thereafter towards and even
below 1.07. In addition a close today below
1.0842, if seen, would be a
bearish outside day.
A close above 104.45 would also be a bullish outside day in the USD-Index (DXY) as would a close above 1,257.92 on the BBDXY
The other FX chart that still looks good is USDCAD which is now testing the April trend high at 1.3846 and has completed a double bottom above 1.3792 that suggests a move towards 1.4000.
USDJPY perfectly hit its 151.91-95 target and also looks like a base could be forming for now.
The China 2's 10's curve has so far "hit a brick wall" at +70 bp's just as it did in October 2022, thereby avoiding completing a major double bottom (at least for now). This as the China 2-year yield fall has stabilised at 1.51-1.52% while the 10-year yield has moved to new trend lows at 2.153%.
In October 2022 the move lower in this curve came as Chinese yields stabilised and actually moved higher for a while led by the 2-year yield (Bear flattening). As yet we have not seen signs of this developing.
The other development to watch for is that in late Oct 2022 the move lower in Chinese equities turned. This may be interesting as the HSCEI Index has just bounced off the 200-day MA at 5,966 and the Shanghai Comp. is stabilising (a little) in recent days.
Es1 is more balanced for now. I have been focused on the similarities between now and 2000. In particular, recently, in the correction that began on 17th July 2000 and this correction. Back then that correction was about 7% and lasted until 28 July before a bounce that took us back into September 1st before the real turn lower began. This time so far, the correction has been 5% and stopped on 25 July at the 55-day MA (now 5,454)
While not yet a sign that the correction has run its course, it makes the picture more balanced near-term. First good resistance to watch in that respect is 5,542