
So up until the close last week I believe that the USD was on the cusp of materially negative technical developments (monthly reversals) that were set to argue for multi-month USD weakness.
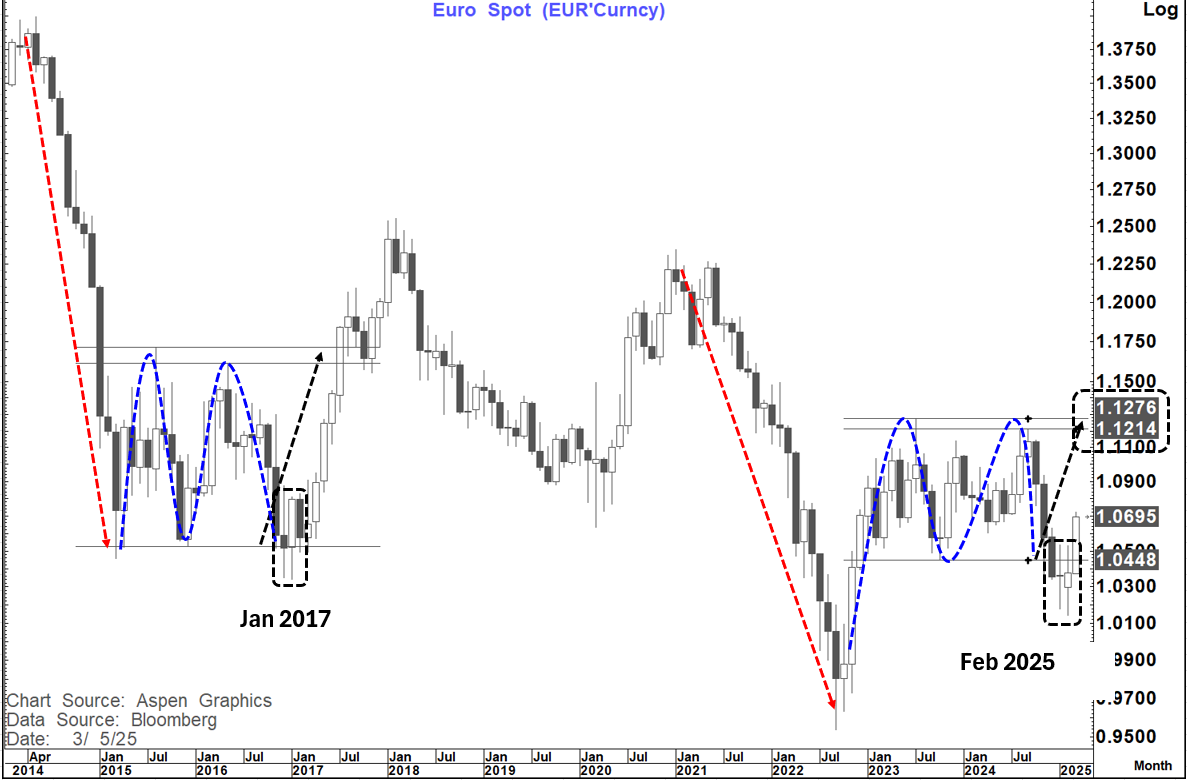
I was looking at the analog of January 2017 as the backdrop in that sense
Then the monthly reversals failed to develop and instead we saw a number of bullish USD reversals on the weekly charts. (In particular on both the BBDXY and DXY charts)
While I try and avoid placing too much emphasis on daily technical developments in this environment, I look at weekly developments as more significant and saw that flip as a technical failure in the bearish USD case.
I was wrong- MEA CULPA
As J M Keynes is famously quoted:
"When the facts change, I change my mind. What do you do sir"
In July 2012 Mario Draghi made the famous "Whatever it takes" speech as the EURO was languishing at 1.20 having fallen from the 1.49 peak in May 2011. At the time few people including myself realised the "psychological" significance of that statement but seven months later EURUSD was at 1.37
The announcements from Germany yesterday may not be in the realm of "whatever it takes" but it clearly signals that the "budgetary shackles" that have seen literally seen no German economic growth since 2022 have been effectively lifted. It is only a matter of time before that expands within the EU.
Rising deficits and increased fiscal/defence spending was the difference in the last 5 years between the growth dynamics seen in the US and the EU so at least for now this has to be viewed as a game changer. Yes, it sends yields higher but debt to GDP in Germany is only around 62% compared to the present 122% in the US-giving plenty of scope for expansion.
German is also running significant trade and current account surpluses. This is also with the backdrop of Europe realising it finally has to look to be "masters of their own destiny"
It is really only in the last 24-housr in this respect that I feel this has become an "A ha" moment for me(I am slow that way)
So, what does that mean now for EURUSD
Despite the failure to achieve a bullish monthly reversal last month (Close over 1.0533) EURUSD still looks like it is in a very similar position to 2017.
Back then it took 7 months to get from the top to low of the range and after Jan 2017 it took 6 months to get back there. This is a smaller range which saw most of the fall over 3 months.
Therefore, it is not a stretch to think of a possible 1.12-1.13 move this quarter
Supporting this now is also the surge we have started to see in European Equities (Capital inflow) but also what has been happening on yields both in absolute and relative terms.
German yields are soaring on this news while US yields continue to languish resulting in a dramatic narrowing in the US-Germany yield spread.
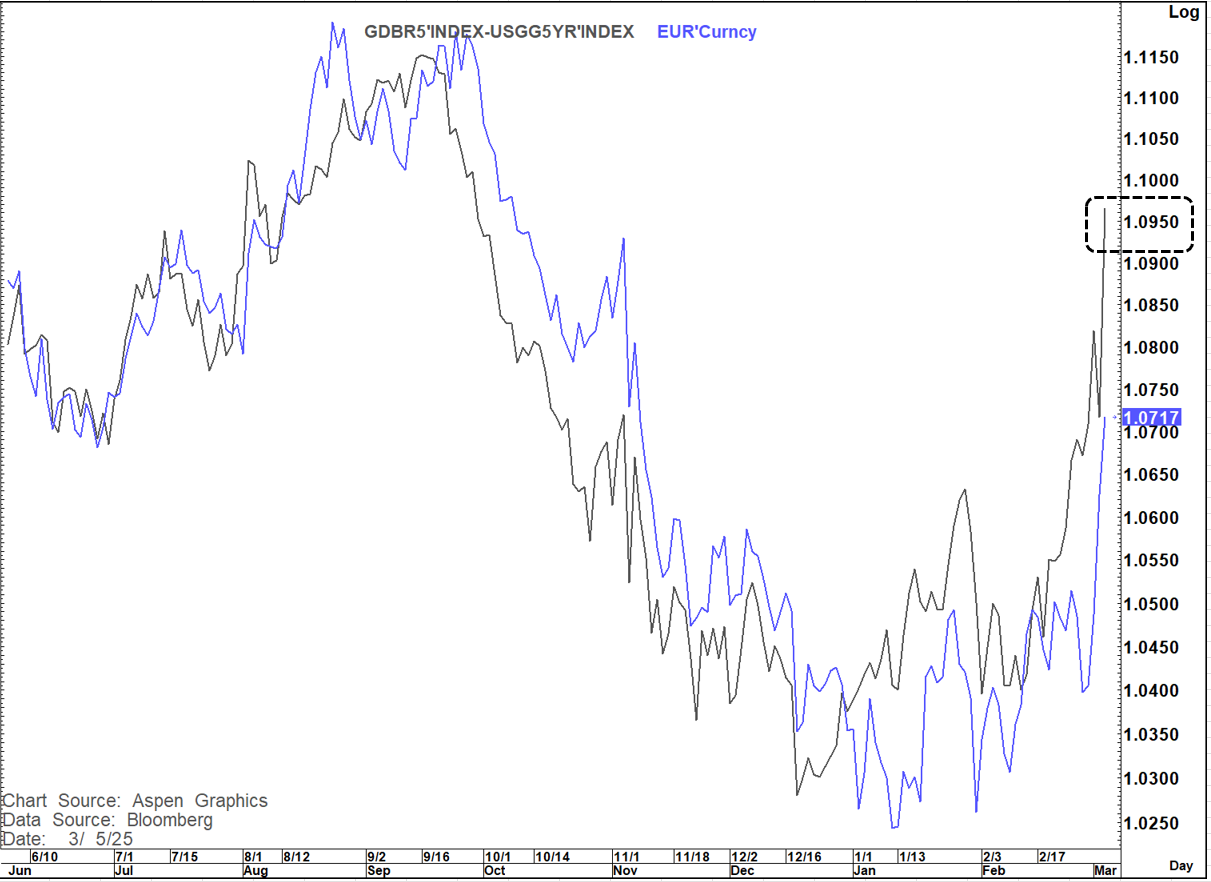
In recent months I have been watching the 5-year yield spread in particular which has translated well into the direction of EURUSD.
As you can see from the chart below that spread now suggests that EURUSD should be closer to 1.0950
On the German 5-year yield chart we have seen a double bottom complete this morning that targets a move to 2.53% while two other double bottom necklines at 2.35% and 2.77% respectively would target 2.85% and (for another day) even as high as 3.69%
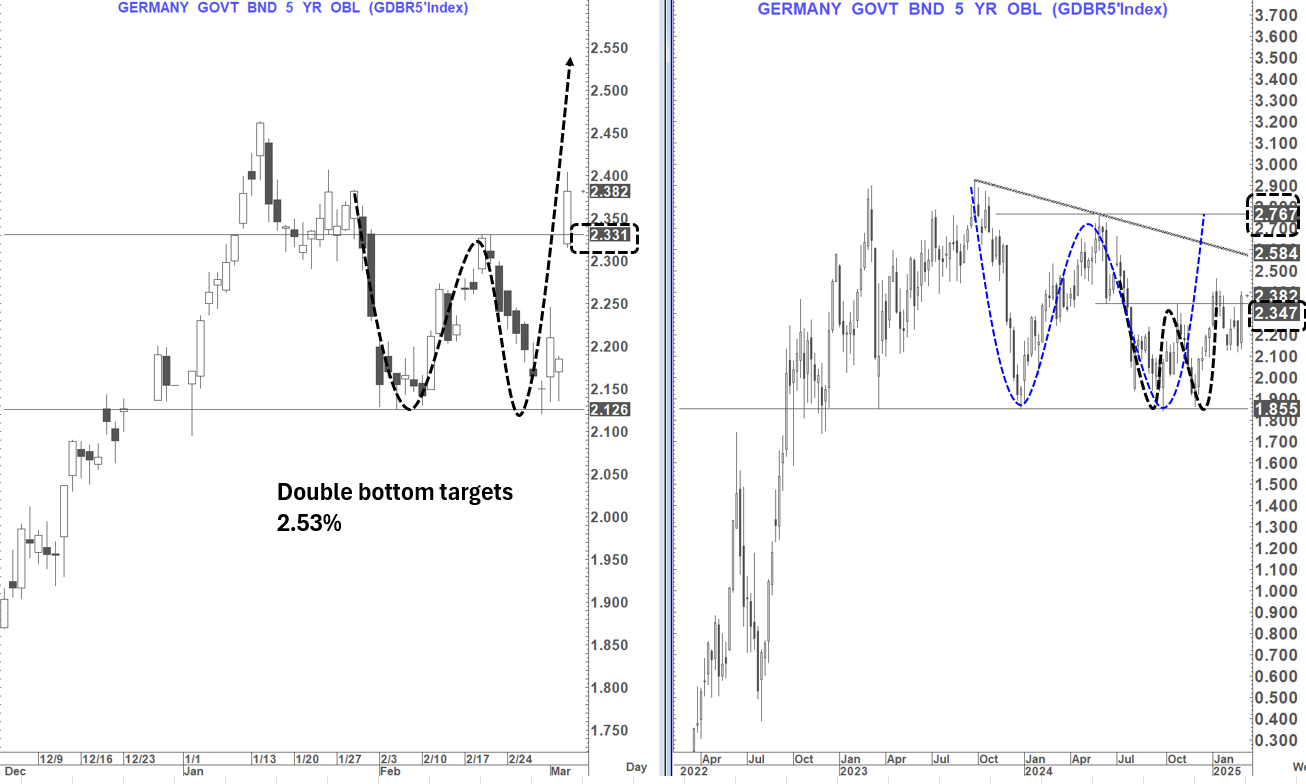
This adds fuel to the potential for this yield spread to narrow even further especially as i still retain the core view that US 5 year yield may continue to head lower still.
It is rather telling after the move higher in German yields this morning and the surge in European equity markets that US yields have moved lower again and the overnight rally in Equity markets seems to be "flagging"
To sum up, we seem to have a J M Keynes moment here right now and at least for the foreseeable future it looks like rumours of the death of the 2017 analog (spread by me) have been greatly exaggerated.