
There has been a lot of "chatter" about Jan 2017 in particular with reference to the USD and at the moment that narrative does NOT look so misguided. That could suggest implications not just for the USD in the near term but also yields, yield spreads, equities, Gold and Oil
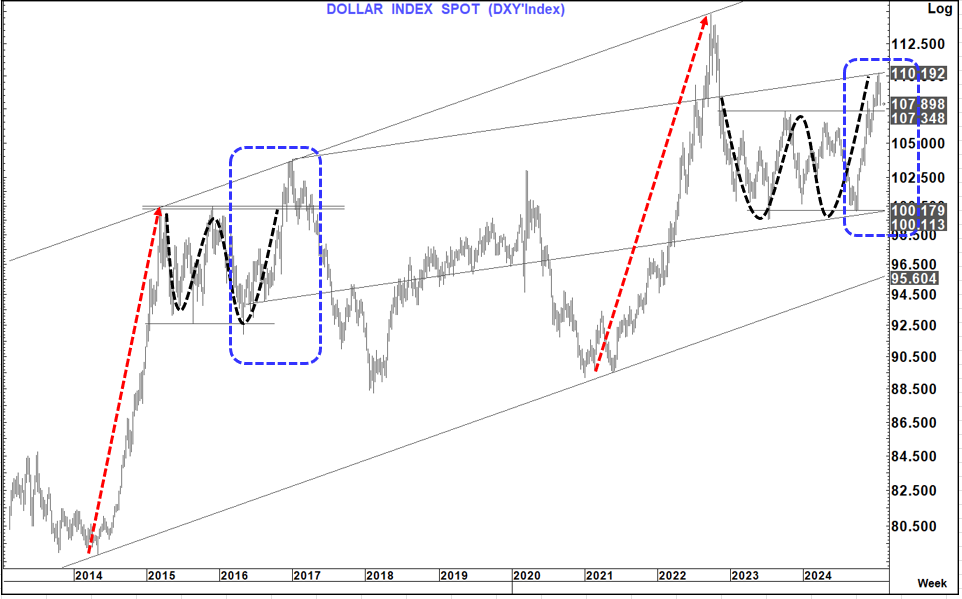
In fact, the whole 2021-2025 USD-Index move bears a similarity to that seen in 2014-2017, but in Particular the last leg from September last year looks similar to that seen in Sept 2016 to Jan 2017.
This brings the breakout area into focus around 107.35. Like in late 2016 that breakout suggested much higher levels close to 115 but as we see we never got there in 2017 and reversed /turned off the peak in the first week of January in what turned out to be a bear market for the USD for the whole year.
A weekly close back below that 107.35 would at a minimum call into question renewed USD strength for now.
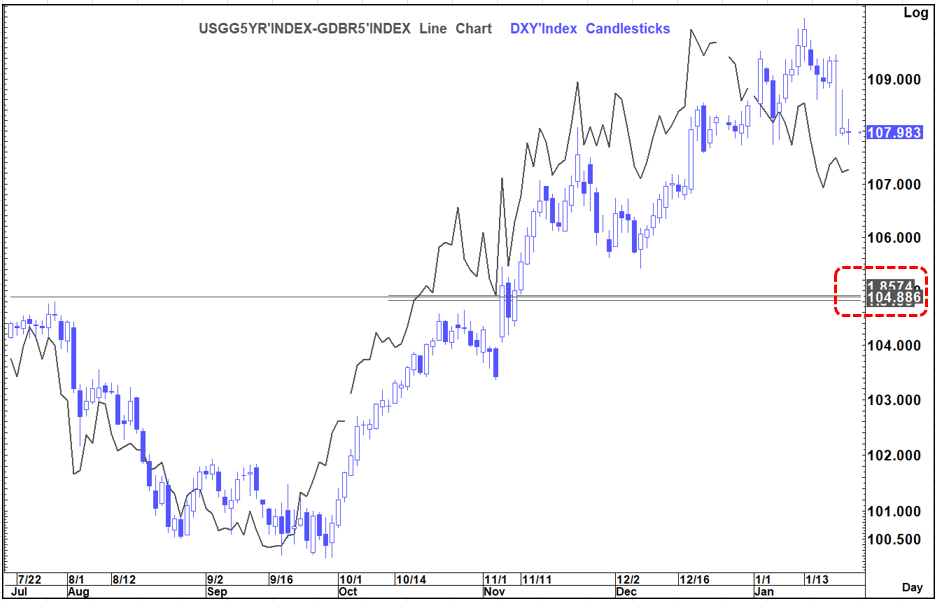
For now, yields are operating on the same playbook. I have been at pains to point out that the USD (In particular EURUSD and USDJPY) have been trading closely to yield differentials- particularly the 5-year yield.
On that chart below you see that relationship to the USD-Index on the left and the comparable picture in Jan 2017.
In fact, if anything, the present yield differential suggests that the DXY Index should be closer to 106.5 right now.
It is going to be hard (absent a risk off event) to see the USD rally right now even if this spread does not change let alone if it narrows further.
So clearly what the spread does from here (and by definition US yields) is going to be instrumental in what the USD does.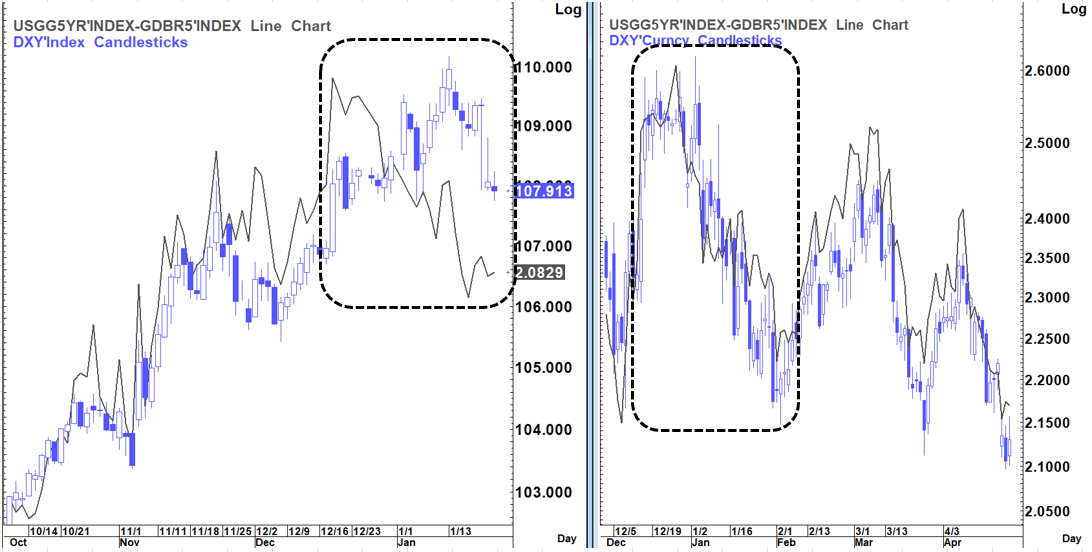
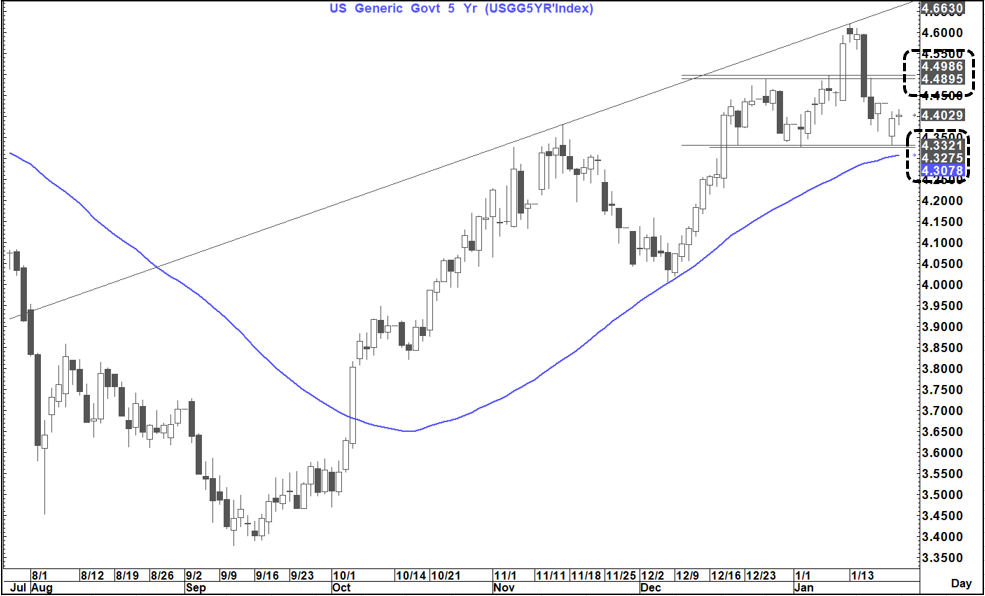
The US 5-year yield is in a range at the moment between 4.31% and 4.33% below and 4.49% and 4.50% above. IF the lower levels give way (including the 55-day MA which we have been above since the first week of October which dragged the spread wider and the USD-Index higher) the a further rally in the Bond market would be a real danger
A move below the lower levels, if seen, would clearly suggest that we can move lower still, that the spread may well narrow further, and that the USD could also weaken further. We need a close back over this 4.49%to 4.50% range to stabilise that dynamic in favour of the USD.
The level to watch on the 10-year yield that looks pivotal in that respect is 4.49-4.50% (and to a lesser extent the rising trend line and 55-day MA at 4.46% with the upside level at 4.64%

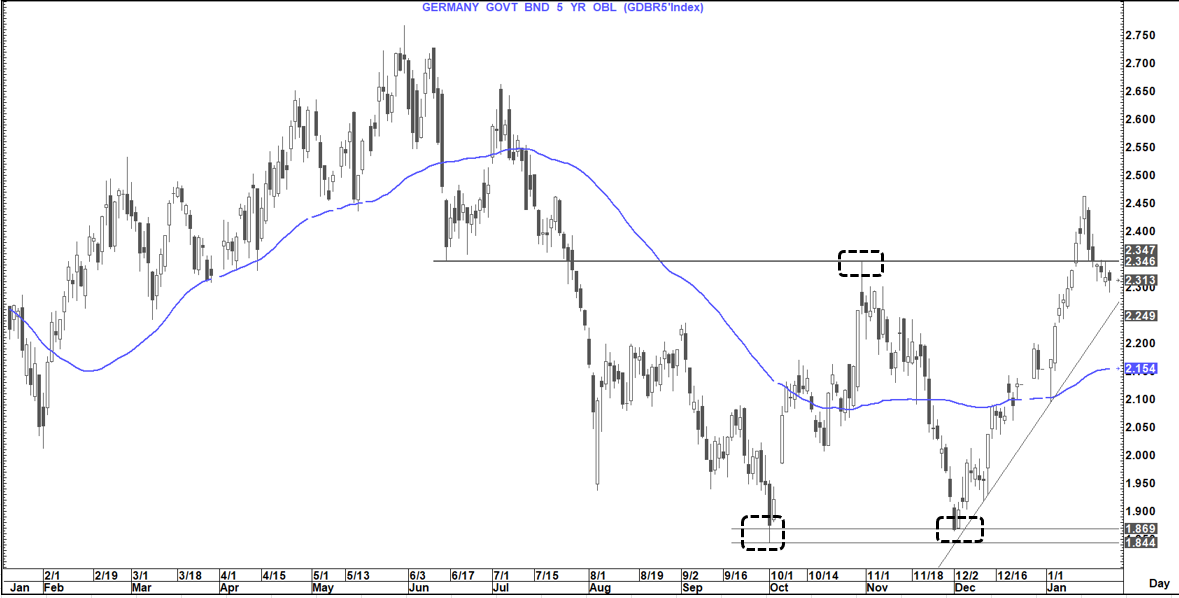
What about German 5-year yield? FX is of course a relative trade
It looks soft also having broken back below a clear double bottom neckline that had suggested much higher levels. What all this really tells you is that in trending moves (up and down) US yields tend to move more and directionality drives the spread at the moment.
How does the spread chart look?
The spread has turned lower off the same peak we saw in 2022 which eventually saw the DXY move lower as it headed sharply down from around November that year.
It is also back below the double peaks seen Nov 2023/ Apr 2024 as well as the 55-day MA.
All this suggests a danger that this fall could extend towards horizontal support and the 200 day MA at 186-187 bp's
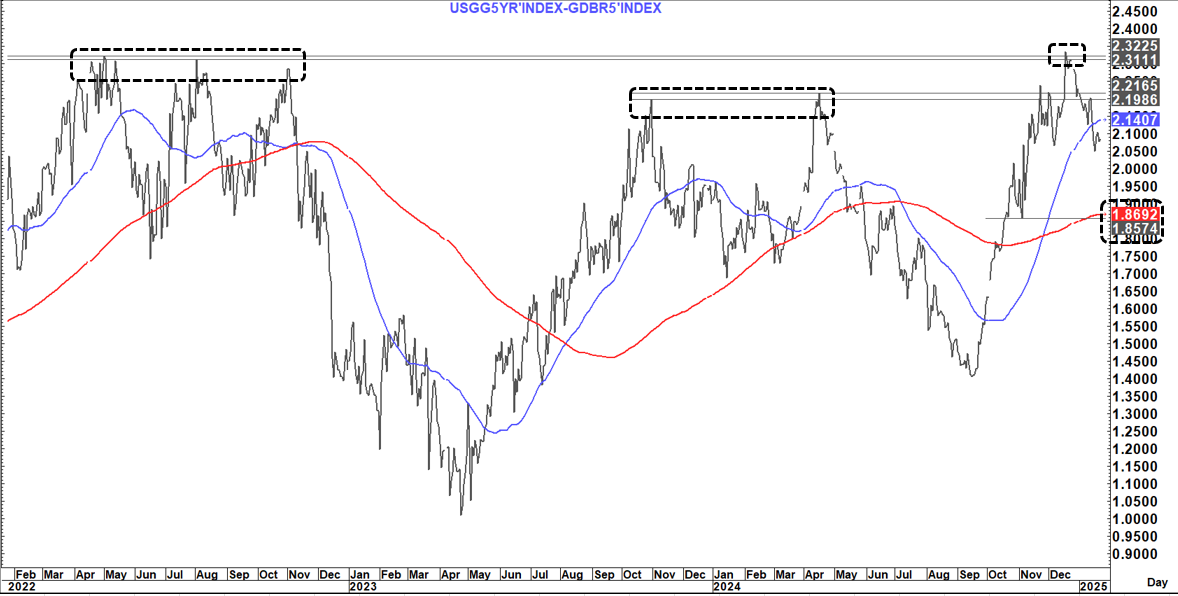
That spread level would be more consistent with a DXY around 105 or below and likely a EURUSD level of around 1.0750.
We could go either way from here but right now the more prescient danger is for lower yields, lower spreads and a lower USD.
We are in a bit of a data vacuum right now, but upcoming inflation and employment data is likely key in this respect.
The first main piece in that respect is PCE on the 31st Jan- but the market forecasters now very closely extrapolate CPI and PPI to that number, so we are really looking post Fed at the employment data in the first week of Feb for guidance (ISM, JOLTS and NFP etc)
That suggests that absent a new risk off dynamic in the equity market of a ratchet up in the "tariff rhetoric" it could be hard for the USD to gain traction.
On tariffs who knows what we get and when we get it but right now on the equity market we are on the cusp of a more bullish setup.
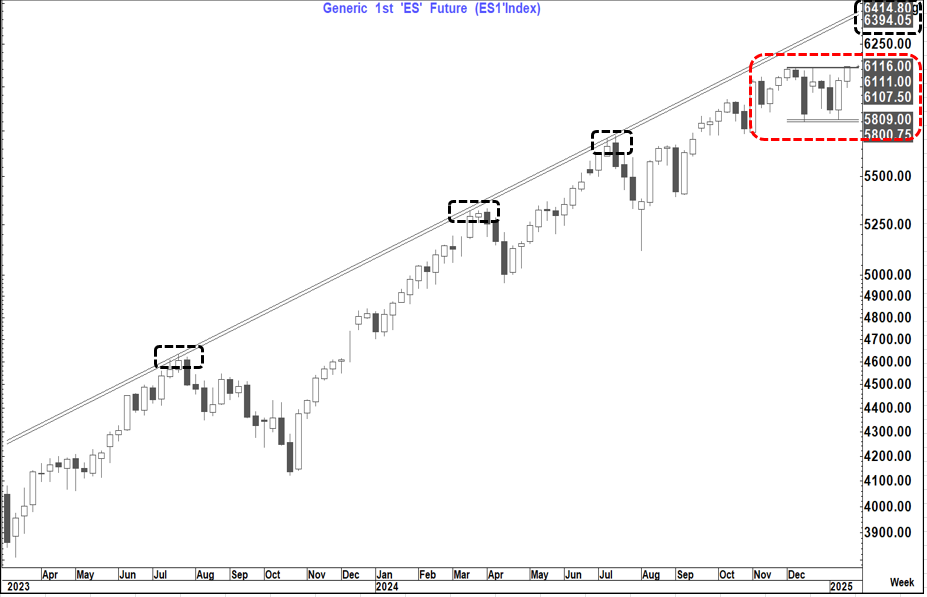
Es1 is now pushing above both the recent high at 6,111 as well as a clear double bottom neckline at 6,107.50. A weekly close above this range, if seen, would suggest a danger of another leg higher to 6,400+ a move that would seem consistent with a lower yield and a weaker USD and certainly not with the development of a risk off USD supportive move.
In 2017 from the start of the year into 01 March we saw Es1 rally 7.4% which if repeated here would open up for a move to about 6,375
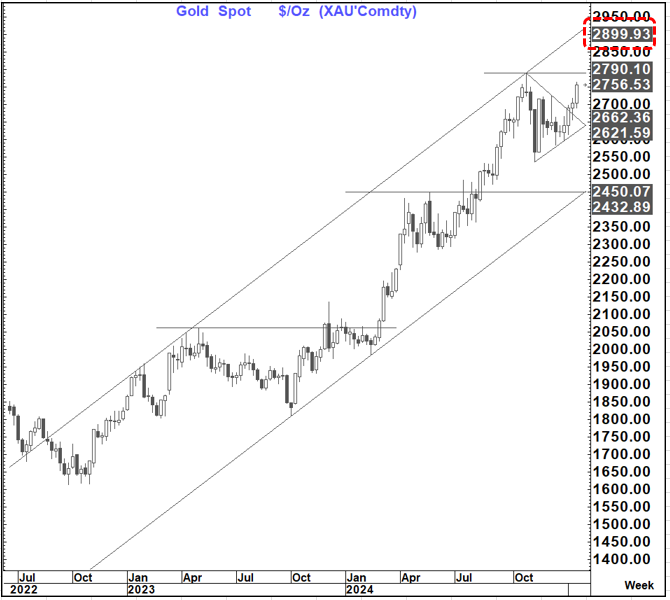
Also, in December 2016 to end Feb 2017 we saw Gold recover and rally about 12.6% as the USD weakened and yields /yield spreads fell.
A similar move this time would suggest a level around $2,907 which is very much in line with the present view
The first quarter of 2017 also saw WTI fall about 15% and last week we failed to achieve a bullish close above the pivotal $78.50 level. A 15% fall would take us back to $69 this time- another yield and equity market support and likely drag on the USD
So, for now, it is not just a "One dimensional" trump inauguration USD down story. The picture across markets does suggest a danger of a Q1 2017 set of moves.
Whether that will continue over the course of the year is obviously a work in progress.
For now, however a path similar to Q1 2017 seems a clear and present danger.