There was a strong sense that Jay Powell delivered a very dovish message yesterday. (He certainly did not deliver the misguided hawkish message that I thought was a danger)
In reality what he really said was that the Fed has no idea what comes next. To me that is different to saying he was dovish.
He effectively resurrected the "transitory" word that worked so well in 2021-2023 not just for the inflation backdrop but also for the economic slowdown.
I am personally more sympathetic to the former than the latter. Why?
Because history clearly shows that it is hard to sustain inflation in an economic slowdown especially if unemployment is softening and the US consumer is tapped out. He did guide that a deterioration in the employment picture would likely illicit a response, but employment is a lagging indicator and by the time you wait for that you are de facto behind the curve.
So, to me what the Fed said is that "we are paralysed with uncertainty" and like Nero we will sit on our hands until the economy burns.
I do not take much solace from that approach, and I am not sure the equity market will continue to either.
Notwithstanding that- what now for markets?
Yields
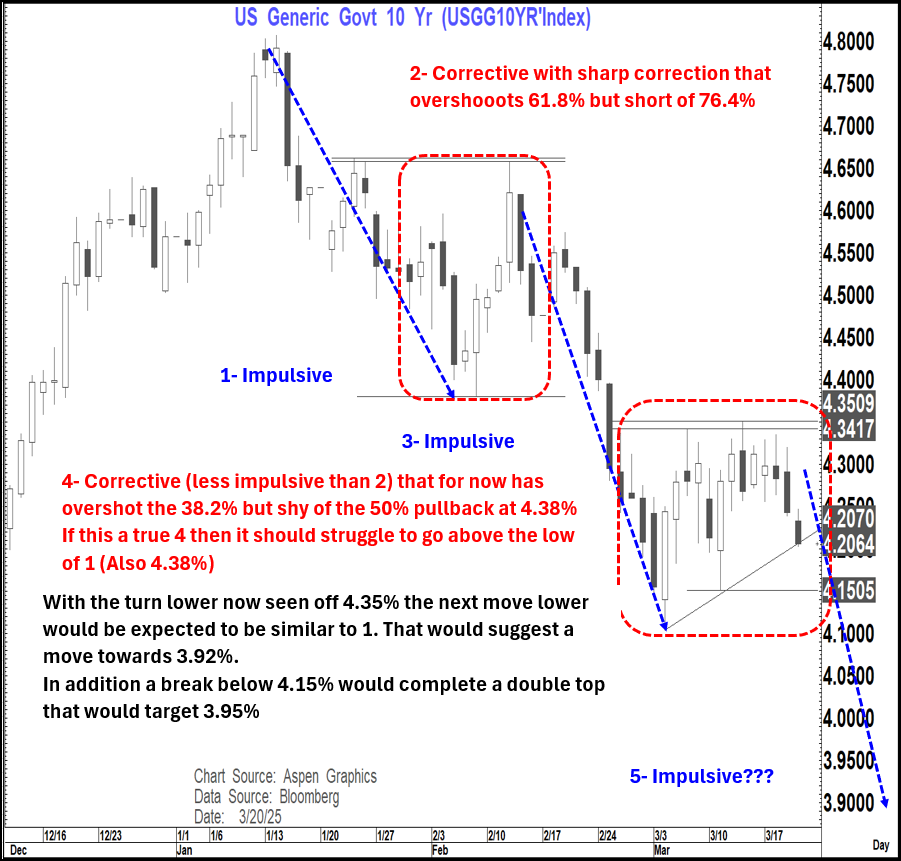
Whether one takes the "Dove" or the "Nero" narrative both argue for yields to go lower. In that respect I did put out a US 10-year yield chart yesterday that clearly suggests a danger that we have started the next move lower targeting 3.90-3.95%
We see a similar picture on the US 5-year yield which suggests a move towards 3.70%
What might this mean for the yield curve?
If you think the Fed intends to imminently cut rates, then 2's 5's and 2's 10's should steepen. If you do not (I am presently on that page) then these curves should initially bull flatten before reverting to a bull steepening as the Fed "cracks"
That likely means the 2's 5's (my financial bible) will invert again. Where to?
Initial targets would be minus 3 and below there minus 12 with a chance that we head into the minus 15 to minus 25 range. This has historically (outside of the recent inflation era) been an area that has warned of incoming economic/market deterioration.
Equity markets bounced...BUT
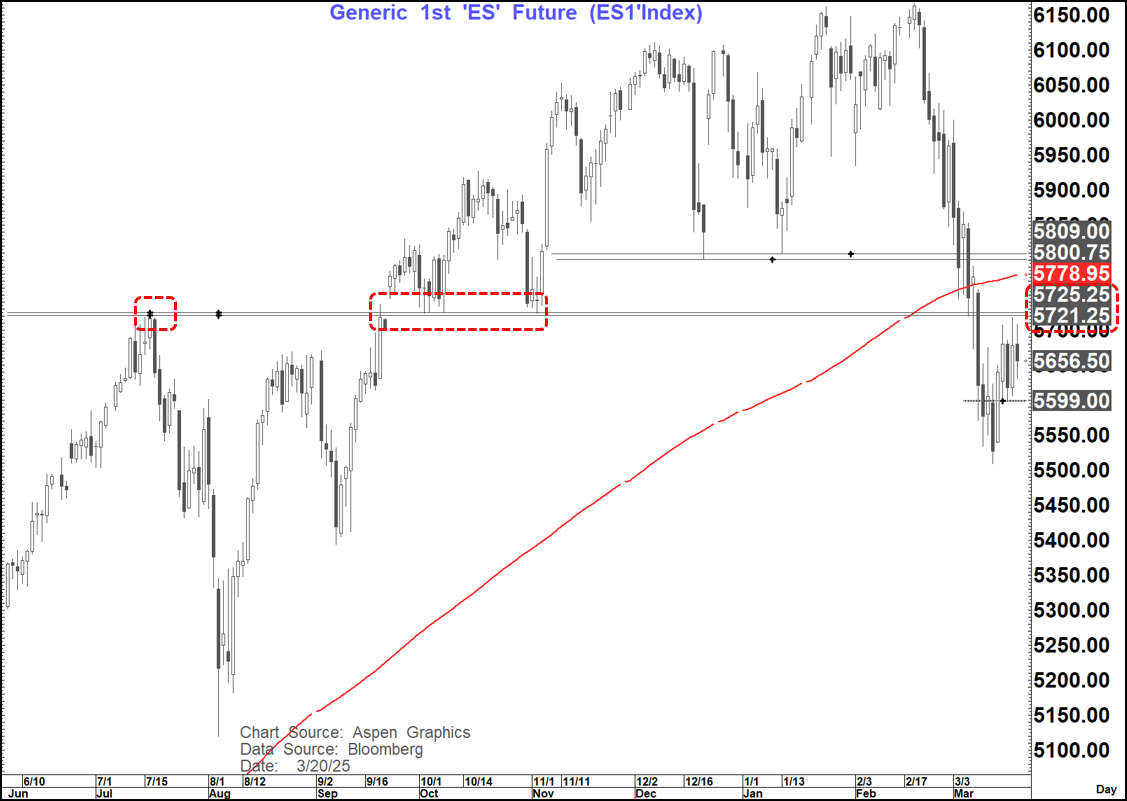
I have articulated the view that the analog comparing Es1 today to July-Aug last year would break down as the backdrop today is very different to then. I became less convinced that the bounce would therefore get to my original 5,770-5,800 area before turning lower again. I still maintain that scepticism despite yesterday's bounce.
Back then the rally tested and broke through the all-time high resistance area at 5.721, accelerated, re-tested the 5,721-5,725 area and headed higher again.
Yesterday the rally peaked at 5,718.50 before falling away.
IF we break over 5,721.25 to 5,725 then that would clearly put that 5,800 area back in play but so far, we have failed.
Similarly, IF we break below 5,599 it starts to look like we are heading lower again
******All these levels above are on the Es1 chart that tracked ESH5 and we have now rolled to June. In that respect the upper resistance is now 5,780-5,785 (instead of 5,721.25 to 5,725) and the lower level is 5,651 (instead of 5,599)
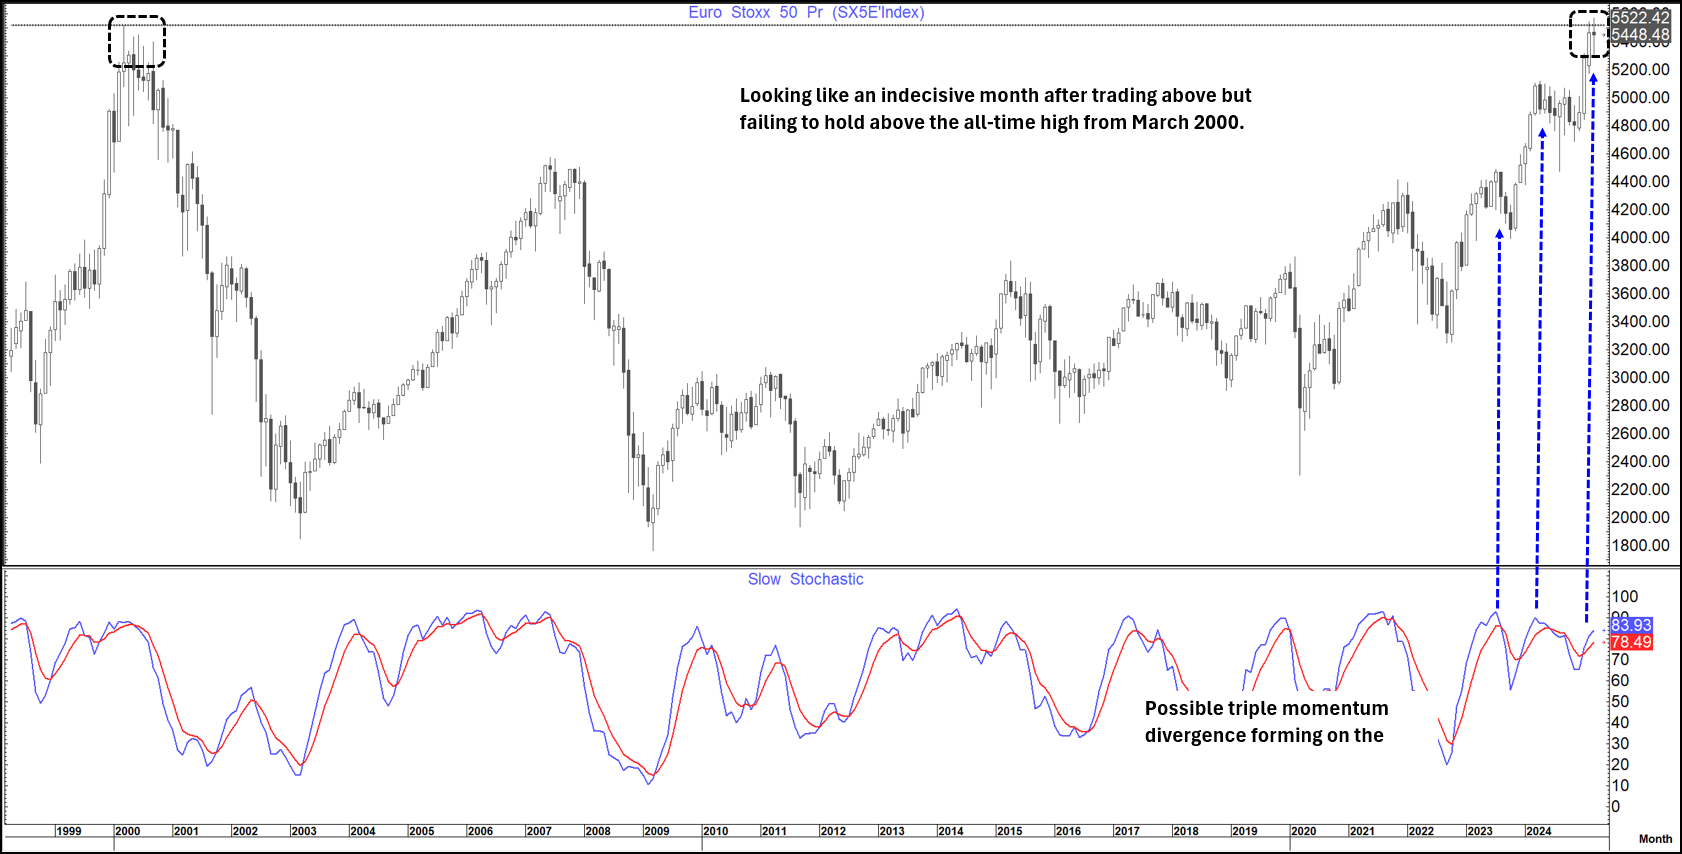
Long-term charts on some of the European indices (VG1 and SX5E) also question the emergence of European exceptionalism and are starting to look like buy the rumour sell the fact trades.
Commodities
Copper remains solid and still looks set to trade to the double bottom target of $560
Yesterday I expressed concern about a possible short-term correction in Gold on the back of the Gold/Silver ratio rising again. Gold just continued higher post Fed BUT it has since fallen sharply. Watch in case it closes today below $3,023 as that would give us a bearish outside day at the trend high and suggest that a correction is still in play.
FX
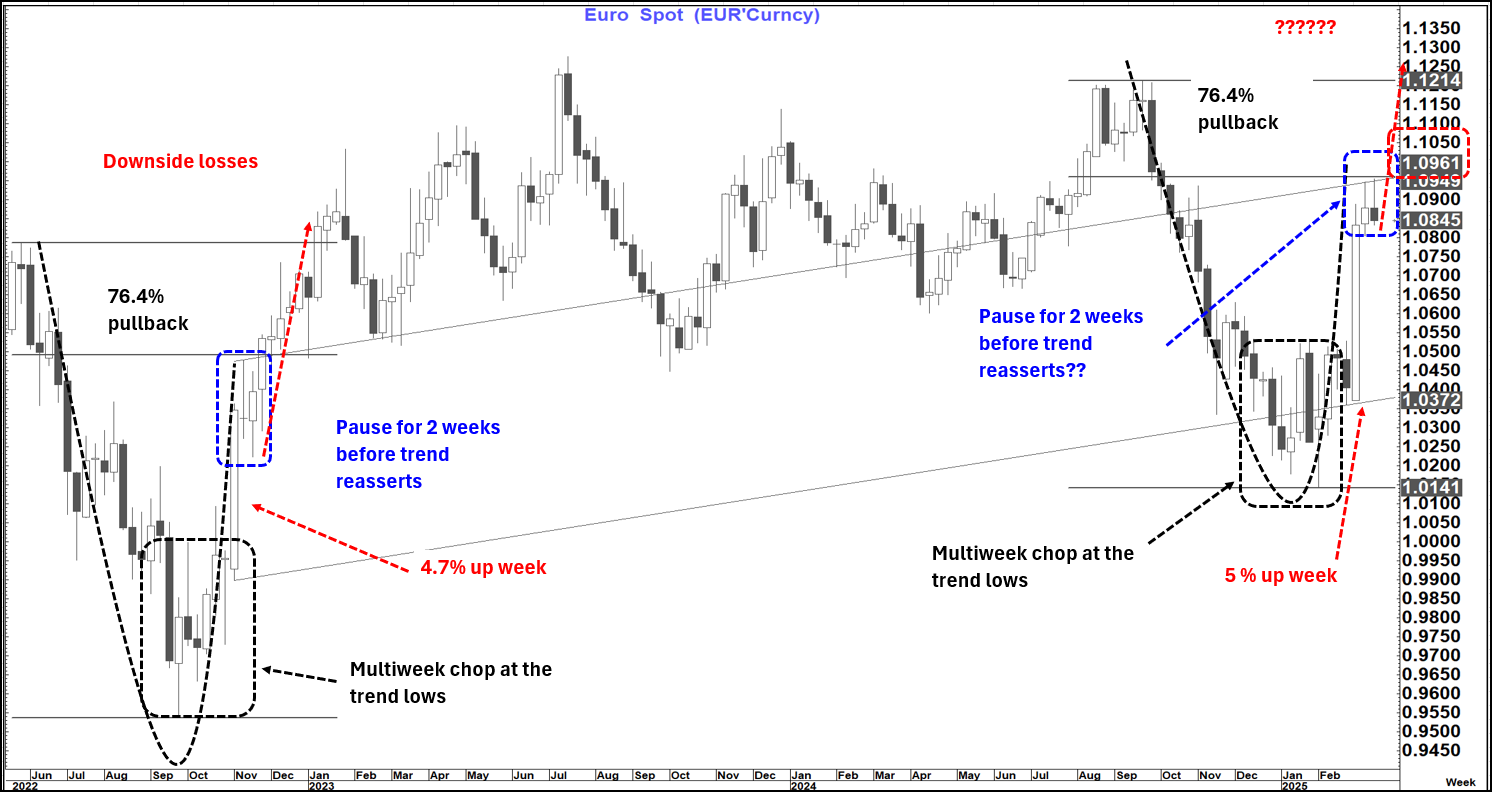
The EURUSD analog from 2022 remains in play and still suggests a danger of a short-term move lower in EURUSD towards 1.07 before higher again.
Initial support is met at 1.0823 and a close below opens up that 1.07 area
GBPUSD and USDCHF also look susceptible at the moment.
A close today below 1.2955 today would be a bearish outside day on GBPUSD while a close above .8809 on USDCHF would be a bullish outside day on USDCHF off good support.
On the other side USDJPY posted a bearish outside day yesterday off its 76.4% retracement level and looks set to go lower. Initial support is met at 147.39 and then 146.54. Below that latter level and a move towards 144 looks a danger. This is consistent with the view on US rates.
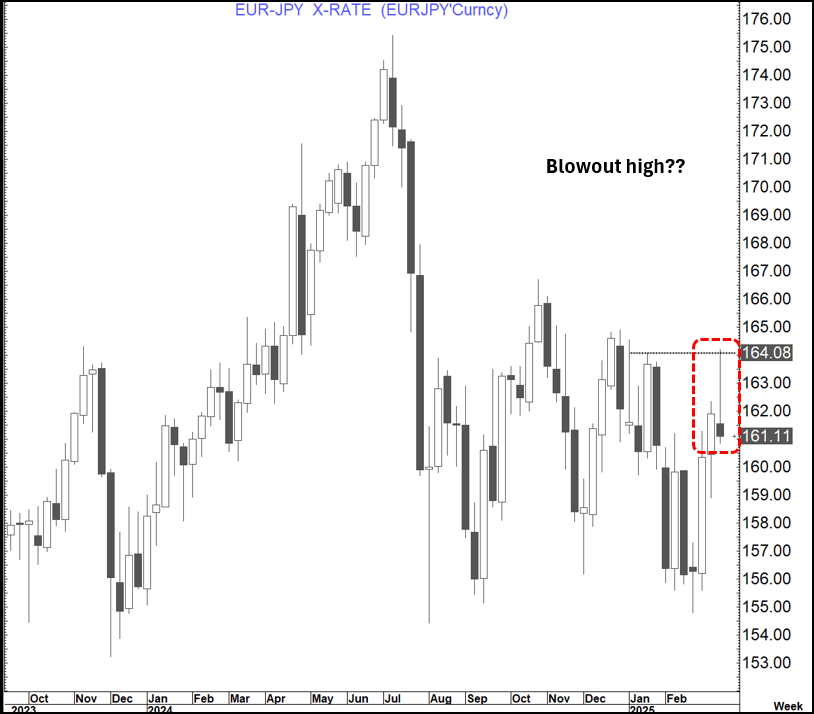
This also suggests that even lower levels could be seen on EURJPY