Better get used to it. We are likely going to see a lot of trends this year that follow the scenic route rather than the motorway. Day to day volatility is going to be colorful at best.
Today I am not going to pontificate too much as it is "The Day After" (The Turmoil) and "The Day Before" (The Fed)
However, there a couple of interesting charts/points
None of the potential breaks/head and shoulders etc. were sustained to the downside on yields yesterday. That does not mean we will not go lower again (my bias is still that we will) but yesterday's move was a totally event driven knee-jerk reaction and we are seeing some stabilisation today. I will still be watching the relevant levels and will post accordingly.
In FX we saw JPY crosses fall heavily in traditional risk off fashion (as well as EURCHF) and then stabilise as yields stabilised and risk bounced a little overnight. Today is likely a day where we rebound somewhat (as we already have) and then we are in danger of just range trading ahead of the Fed.
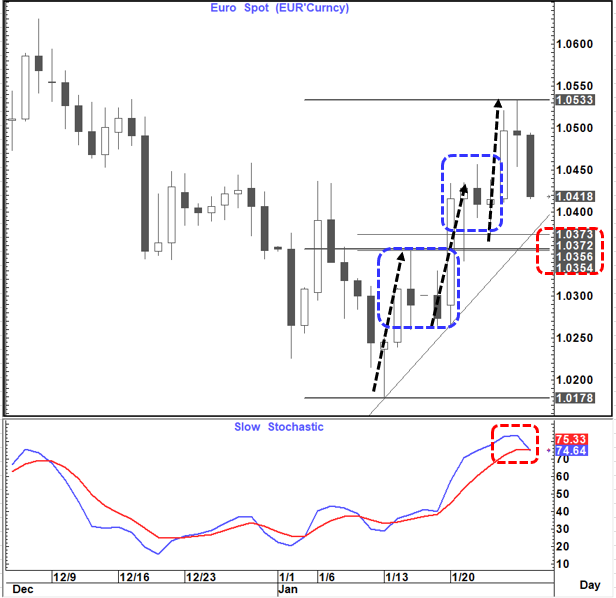
One FX Chart worth watching today is EURUSD which at this point in time looks like an evening star on the daily chart. IF this move is sustained during the day this suggests a danger of an additional pullback into the recent range. Looking at the up move from the lows (3 impulsive and 2 corrective) a pullback towards 1.0350-1.0375 and then look again looks like the gameplan.
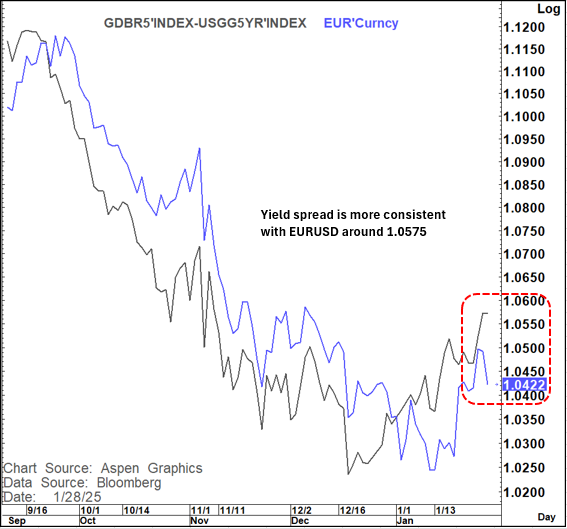
Even If we make that move it is hard at this point to see it being a sustainable one given the big disconnect that exists between EURUSD and the 5-year yield spread.
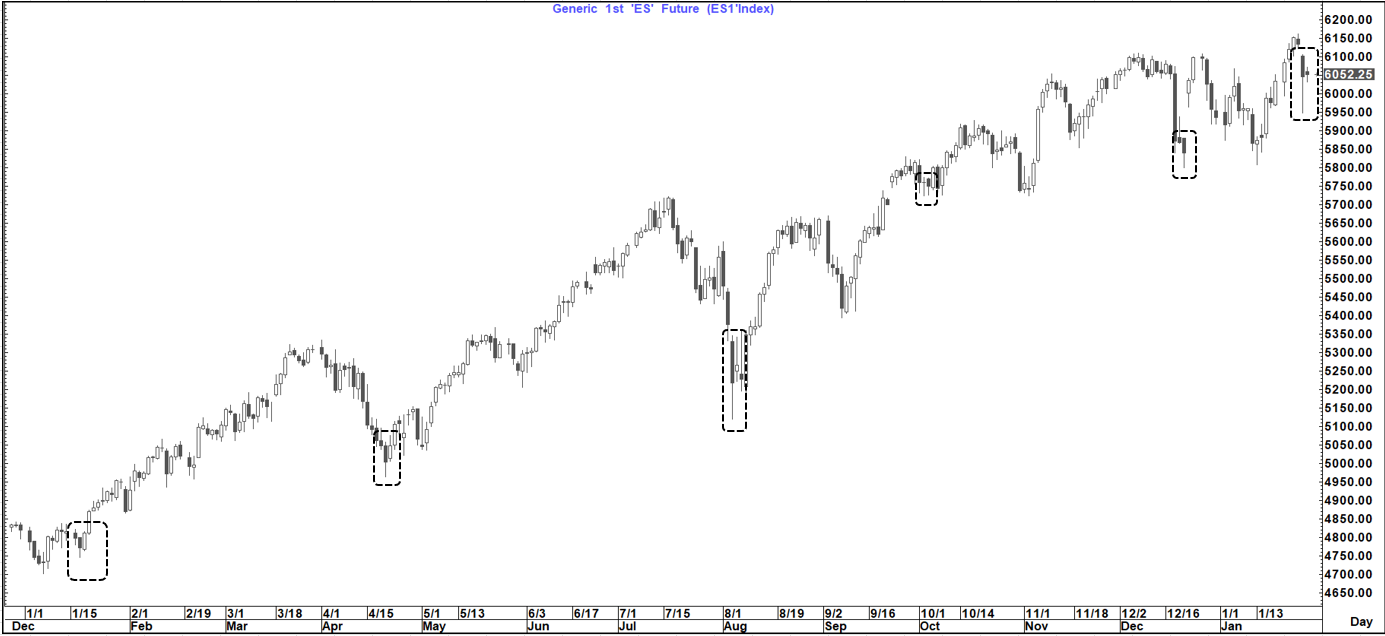
On Equities I put out an E-mini chart last night which is also interesting.
The "Hammer" with a notable down close has been seen pretty much 5-times in the last year.
Of course it could be different this time, BUT....on the prior 5 instances we have seen 2 subsequent developments
1. We have closed up the following day
2. The "hammer" has put in the low of that correction
However, in reality we will need to get back above the 6,100-6,110 area to be "out of the woods again"
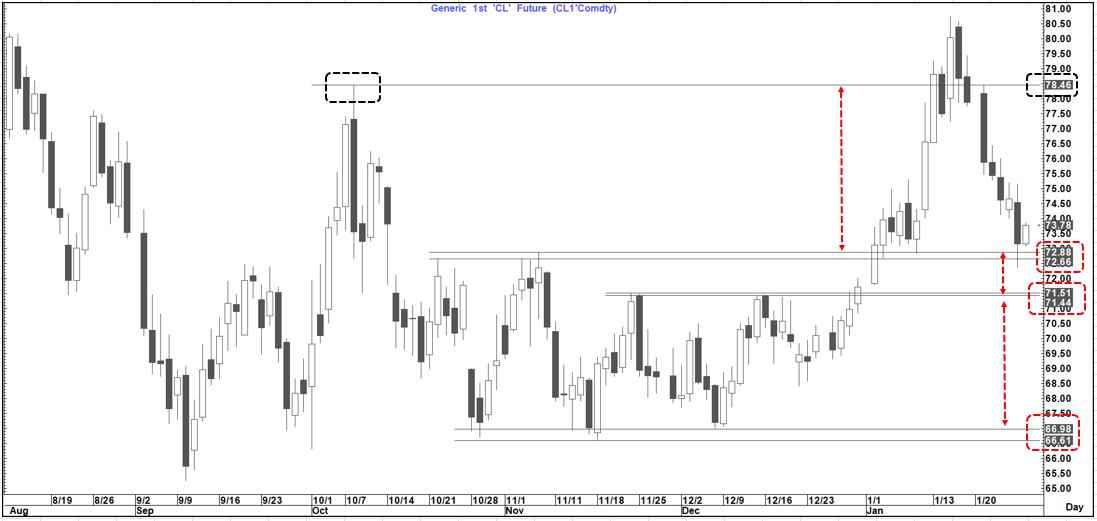
The other chart that remains interesting and compelling is the Oil price (WTI). We seem to have a potential "Domino effect" taking place on the way down after we failed at $78.50 just as we did on the way up after the failure in the mid $60's
We have tested but so far held the 2nd breakout area on the way up at $72.66-$72.88. A close below, if seen, would suggest we advance to test the first breakout area at $71.44-$71.51.
A break below there and a move all the way back down towards the very pivotal support area around $66.60 top $67 would come into play.
Whether we make these moves may be very instrumental in what happens on yields given how closely tied the yield and Oil moves have been recently.
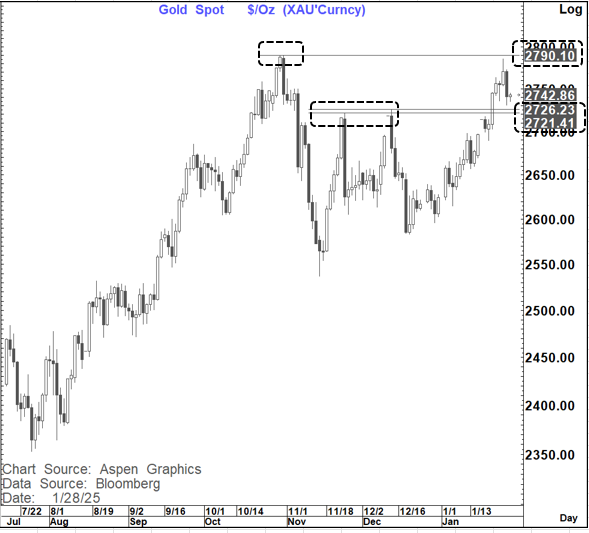
Gold has moved lower as you would expect of any "owned position" when we see a risk off event. However, for now at least it has held above the breakout area at $2,721-$2,726 which would be a good platform for another move to re-test the all-time highs at $2,790.