Hit The Pause Button- Again
The pivotal support levels on Yields, FX and Equities all held yesterday and through the night.
With no data of note today (Market does not really react to home sales and permits much these days) it is all down to NVIDIA's earnings tonight so unlikely any of those levels give way today and if anything, we may see more consolidation/correction.
What are those levels?
YIELDS
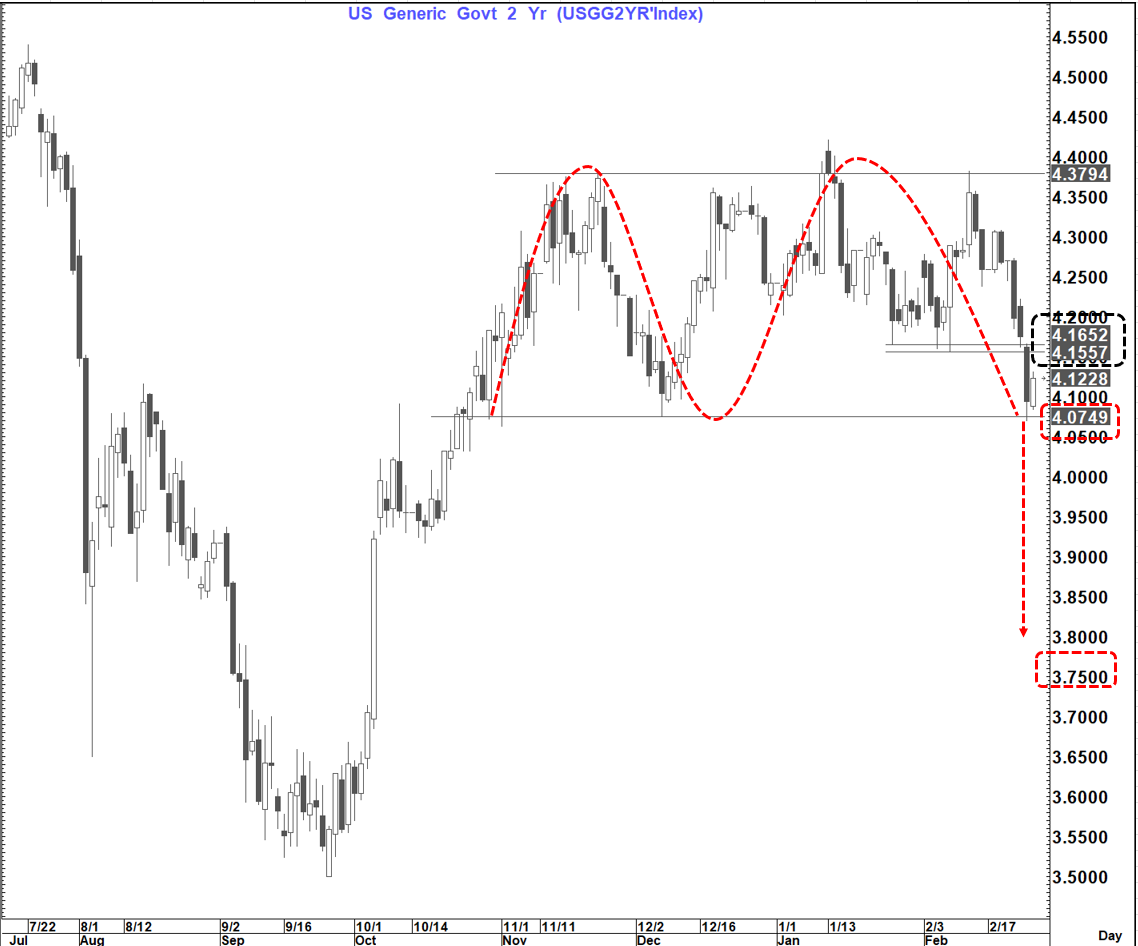
On the US 2-year yield that is 4.075%. This is a big level as a close below would suggest an incremental fall of as much as 30 bp's which would suggest a strong reassessment of when the Fed moves next and likely a move to aggressively price in a May move.
In the near term it would not be surprising if we see this correction continue a little longer and retest the prior support at 4.15-4.17%
US 10-year yield
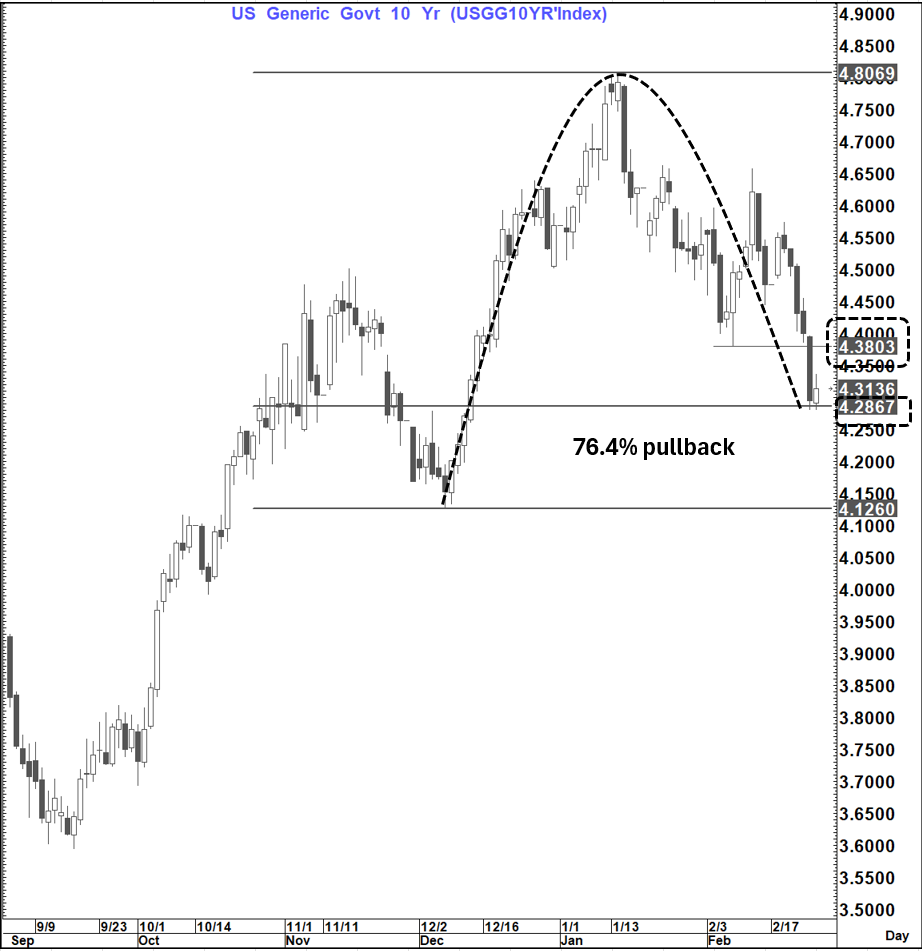
Here we had a perfect hold of the 76.4% pullback level (Of the Dec-Jan move higher in yields) at 4.287% and bounced. A further extension in this bounce towards 4.38% cannot be ruled out. A close below 4.287%, if seen, puts the bull market back in play and opens up for the next move to 4.13%
Equities
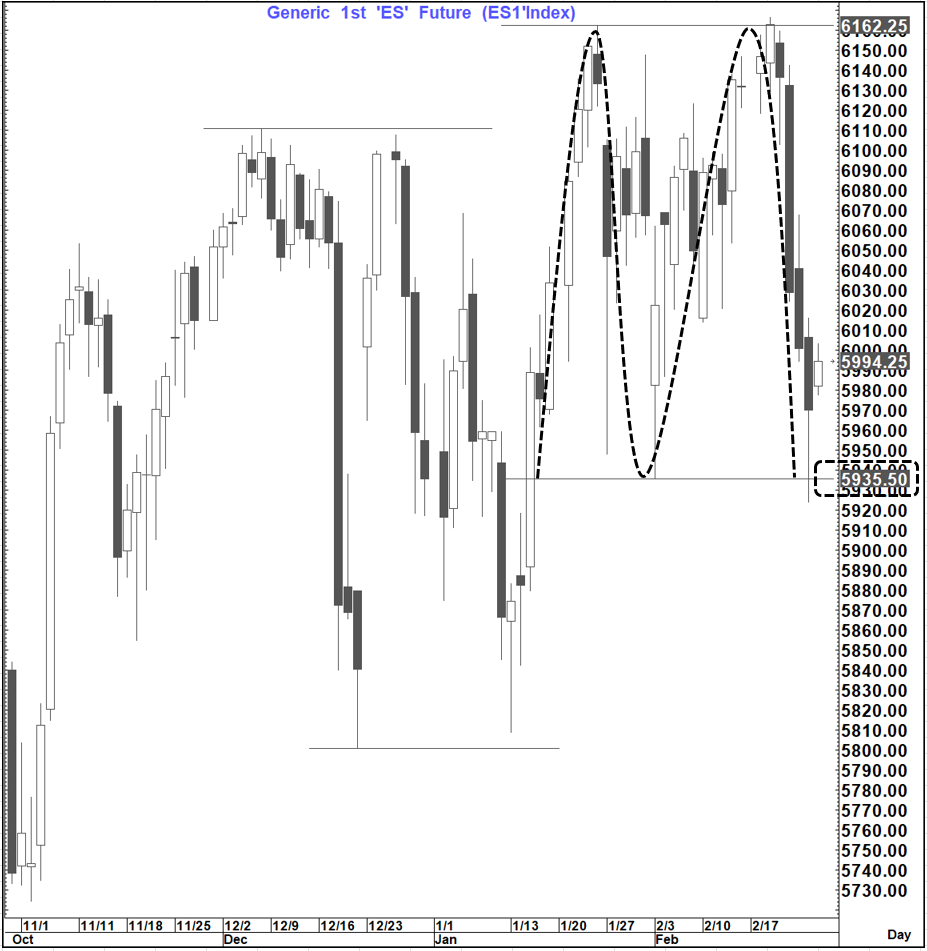
Es1 failed to sustain a close below the double top neckline at 5,935.50 and bounced. this is not unlike what we saw on 13th January, so some short-term caution is warranted. Likely Nvidia's earnings tonight might be an important short-term influence in that respect. If we do get a close below that pivot it would target further losses towards 5,700
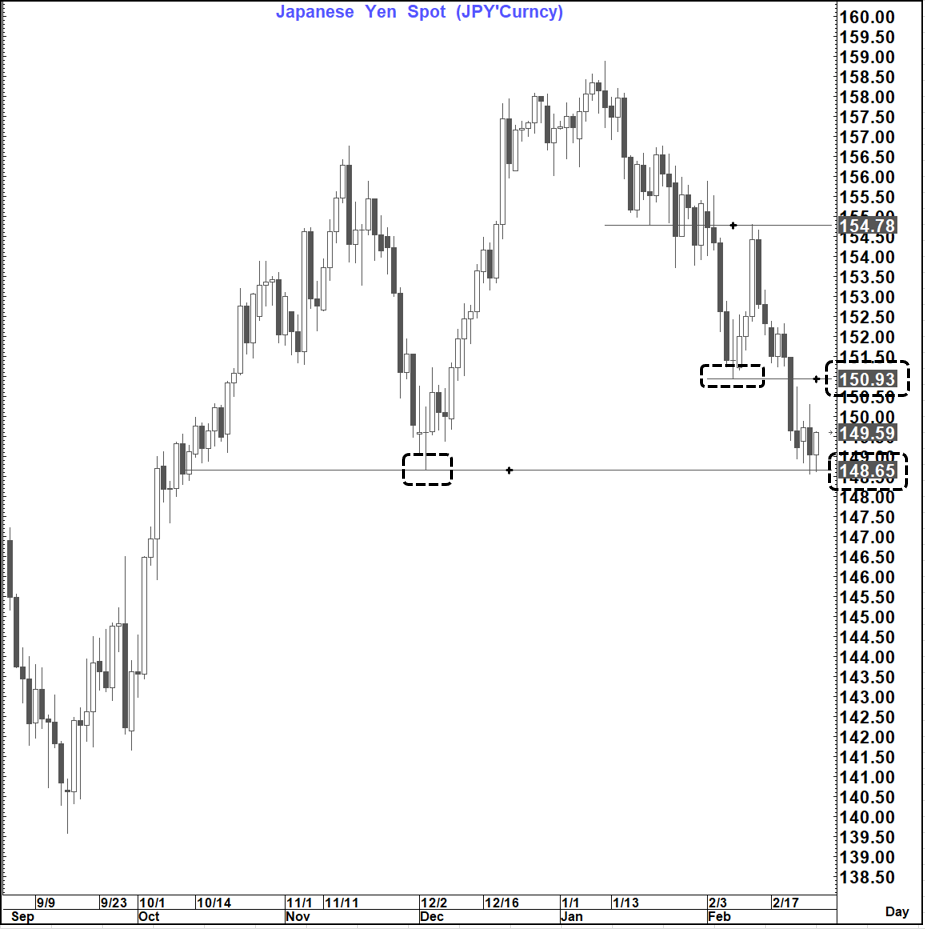
FX
USDJPY hit a virtual "brick wall" at 148.65 support and bounced overnight. Caution is definitely warranted short-term despite the downside bias still being firmly intact.
If the yield bounces noted above did materialise then a move back towards prior support at 150.93 would be a danger short-term.
In the bigger picture the only USD bearish monthly reversal chart that is through the required level at the moment is the BBDXY Index (1,292) with AUDUSD, NZDUSD and USDCAD having all retreated back through those levels.
EURUSD (1.0533) and USDCNH (7.2346) are still "in the ballpark" for reversals with 3 Days to go.
In January 2027 (a big USD turning point) the only monthly reversals we ended up with were BBDXY and USDCNH.
In Commodities Crude Oil (WTI) has sustained most of its losses and still looks likely to head lower towards $66 to $67
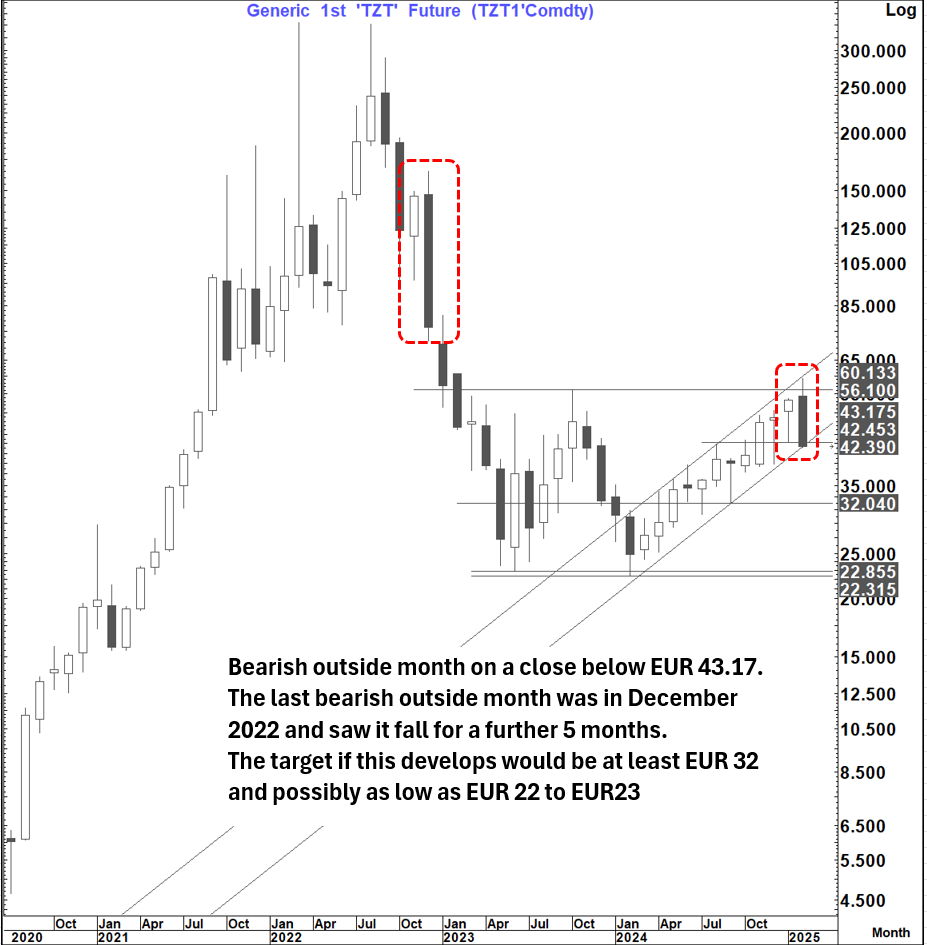
A very interesting chart here is European Nat Gas (TZT1).
It will post a bearish outside month on a close below EUR 43.17. The last bearish outside month was in December 2022 and saw it fall for a further 5 months.
The target if this develops would be at least EUR 32 and possibly as low as EUR22 to EUR23
From a headline inflation perspective and ultimate 2nd round effects these energy charts are pivotal in the inflation/deflation argument as well as the feedback to yields and policy.
My view is pretty clear:
Wars ending
Energy prices collapsing
Govt. spending being reined in (US)
A tapped-out consumer with no savings left
High real interest rates and extremely high mortgage rates
....all feed a strong disinflation story contrary to the almost universal narrative that we will never get inflation back to 2%. This follows the pre covid narrative that we could never get it to stay at or slightly over 2%
So, in the big picture I remain unequivocally bullish fixed income and bearish the USD