Another tumultuous week in Financial markets (Get used to it. It is not ending anytime soon)
So, what charts look interesting to start the week?
Let's start with one of the best charts out there.
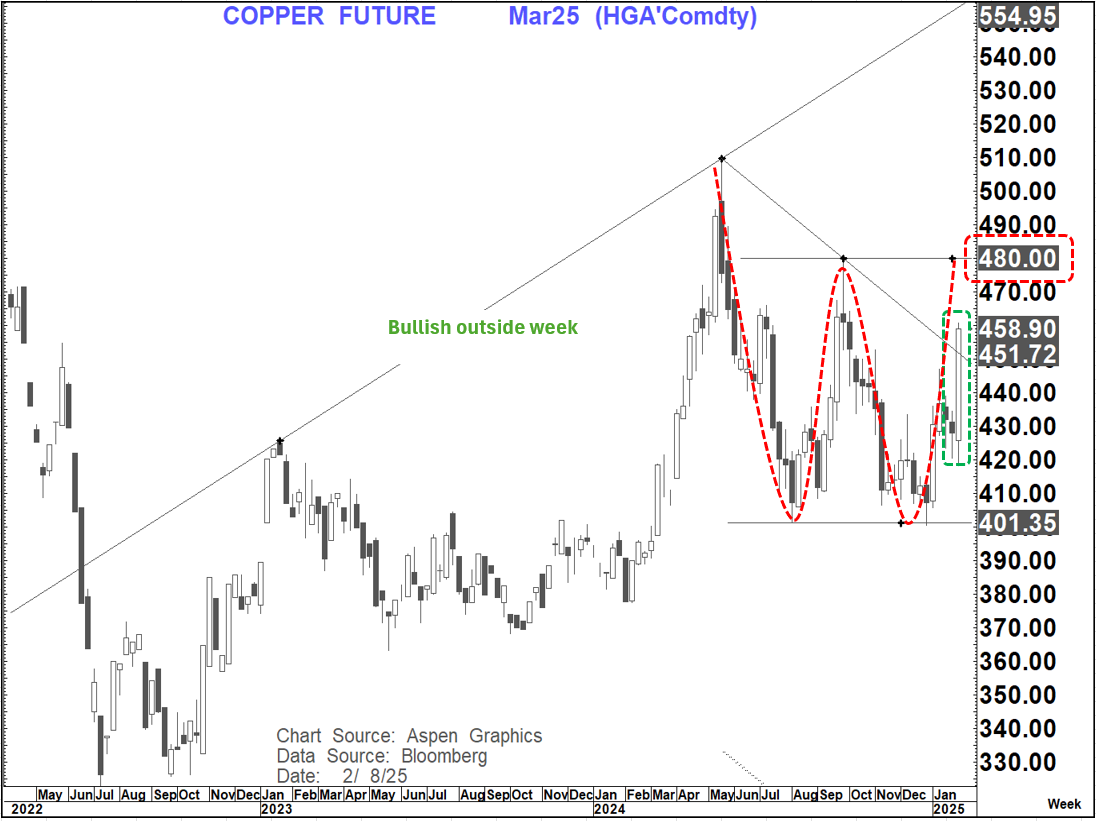
Copper
Is Copper now starting to become an "AI Hype" beneficiary??
Copper is a key component for AI because of its high conductivity and durability. It's used in many aspects of AI, including data centers, power grids, and semiconductor chips.
The Copper chart is looking increasingly bullish and potentially one of the best charts out there.
Having bottomed out in Dec-Jan at almost exactly the same levels as in August last week it posted a bullish outside week as a continuation. This suggests that we can revisit the 4480 level which is the neckline of what could be a significant double bottom. We have also broken above the downward sloping line in what looks like a triangle (consolidation) formation .
The target on a completed double bottom above $480 would be $560 which is still 22% above present levels.
Another hugely interesting chart that is "potentially" developing in Commodity space is
Bitcoin (yes it could also be in the asset/currency space but as the proposed "heir" to Gold (Digital Gold) I still view it in the Commodity space.)
A note on this: I am far from a Crypto expert and probably should reserve my comments for the chart- but that is not me as you know. Even if we accept the premise above a few comments I would like to make.
- The big technological development that is talked about here is blockchain. In the 2000's we also had a huge technological development called the internet which fueled the famous Dot Com bubble. What we did not have was the novel idea of creating the "Intercoin", an investment entity related to the internet that had no earnings, no profitability, no dividends and no business. After the Dot.com manaia the investments that made sense and made money were real companies using and expanding on the new technology World (Apple, Microsoft, Google etc. etc.)
- Now we have a multitude of Crypto instruments including NFT's (Digital Beanie Babies") and "Trump coins" that people have dived into with abandon in an environment reminiscent of "Tulipmania". Thank goodness we do not have egg futures or that would be the "meme mania" of the day.
- Bitcoin does have the benefit of limited supply (similar to Gold) and a digital footprint that Gold does not have. It also has the "benefit" of anonymity that may eventually become too much for Governments (lack of control) over time.
- In the last move higher since November (Around $70k) it has clearly been driven by "Trump Mania" and the belief that the US may establish a "Strategic Bitcoin Reserve". Is that before or after we Invade Greenland, Invade the Panama Canal, Invade Canada and turn the Gaza strip into a new "Snowbird" location. (all tongue in cheek comments obviously) The point I am making here is that this is something that has been talked about, but we have no idea if we should take it any more seriously than the above- not least because it flies in the face of one of the big "qualities" of bitcoin as a "safe-have" for some of the most nefarious.
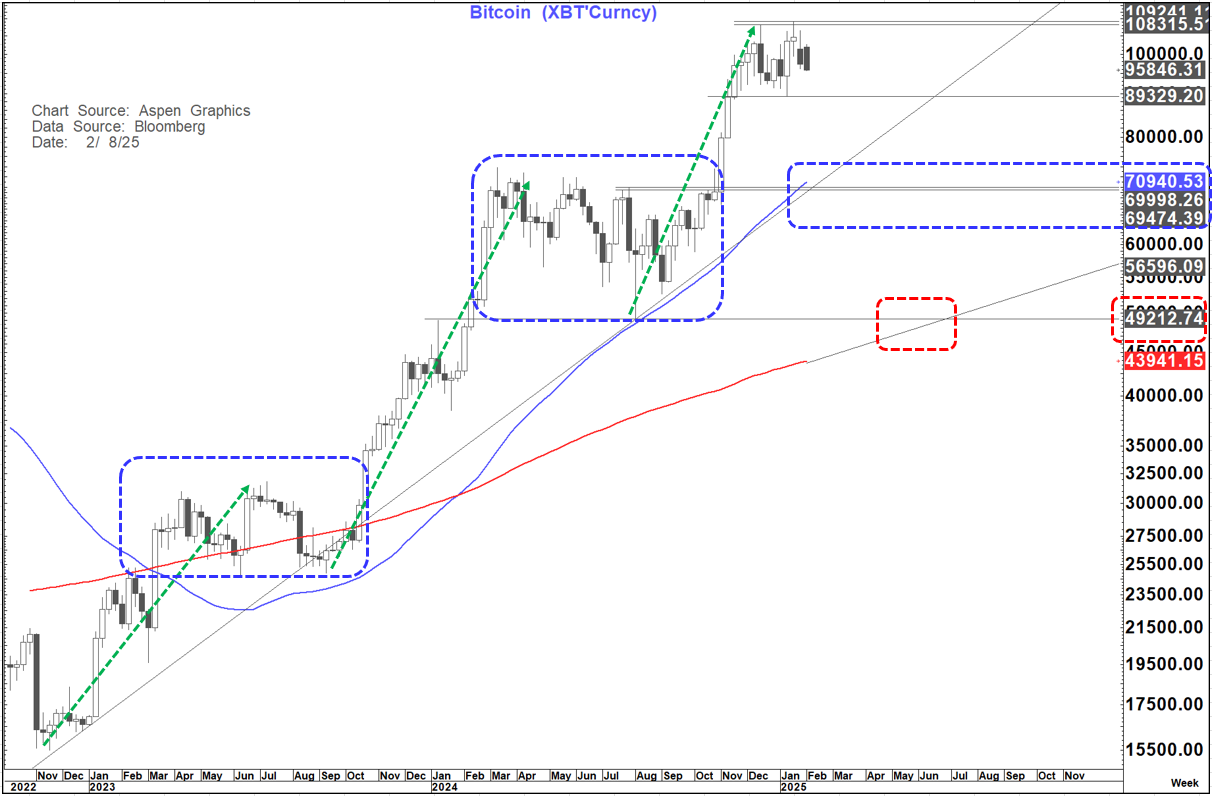
How this all pans out in the big picture we will see but when I look at the chart below, I think the picture is looking precarious.
The measured move on this chart was about $101k (a move of similar percentage to that seen from Nov 2022 to July 2023). we obviously overshot that with the impulsive move higher from November to a peak of around $109k in January
There looks to be a big danger here that a double top may be forming here with a neckline around $89k. If we were to see a weekly close below there it would suggest a return towards $70k, (about 36% off the peak) close to where rising and horizontal support as well as the 55-week MA stand. Reasonings could be what I mentioned above or just a market squeeze or (and I say this from a market, not a political perspective -something happens to Trump)
It has been above the 55-Week Ma for nearly 2 years since March 2023, is very stretched to the 55-Week MA and has created a wide 55-200 Week MA gap.
Technically a weekly close below the 55-Week MA, if seen, would suggest extended losses as far as the 200-week MA which is presently at $44k (about 60% off the peak). It is rising and would converge with what could be considered a 4th wave low (Elliott) at around $49k by end June.
The last time we had this 55-200 Week MA setup was from April 2020 until we got that weekly close in Jan 2022 (21 months) resulting in a high to low fall of about 78%.
Before that was Oct 2015 to June 2018 (32 months) which yielded a fall of 84%.
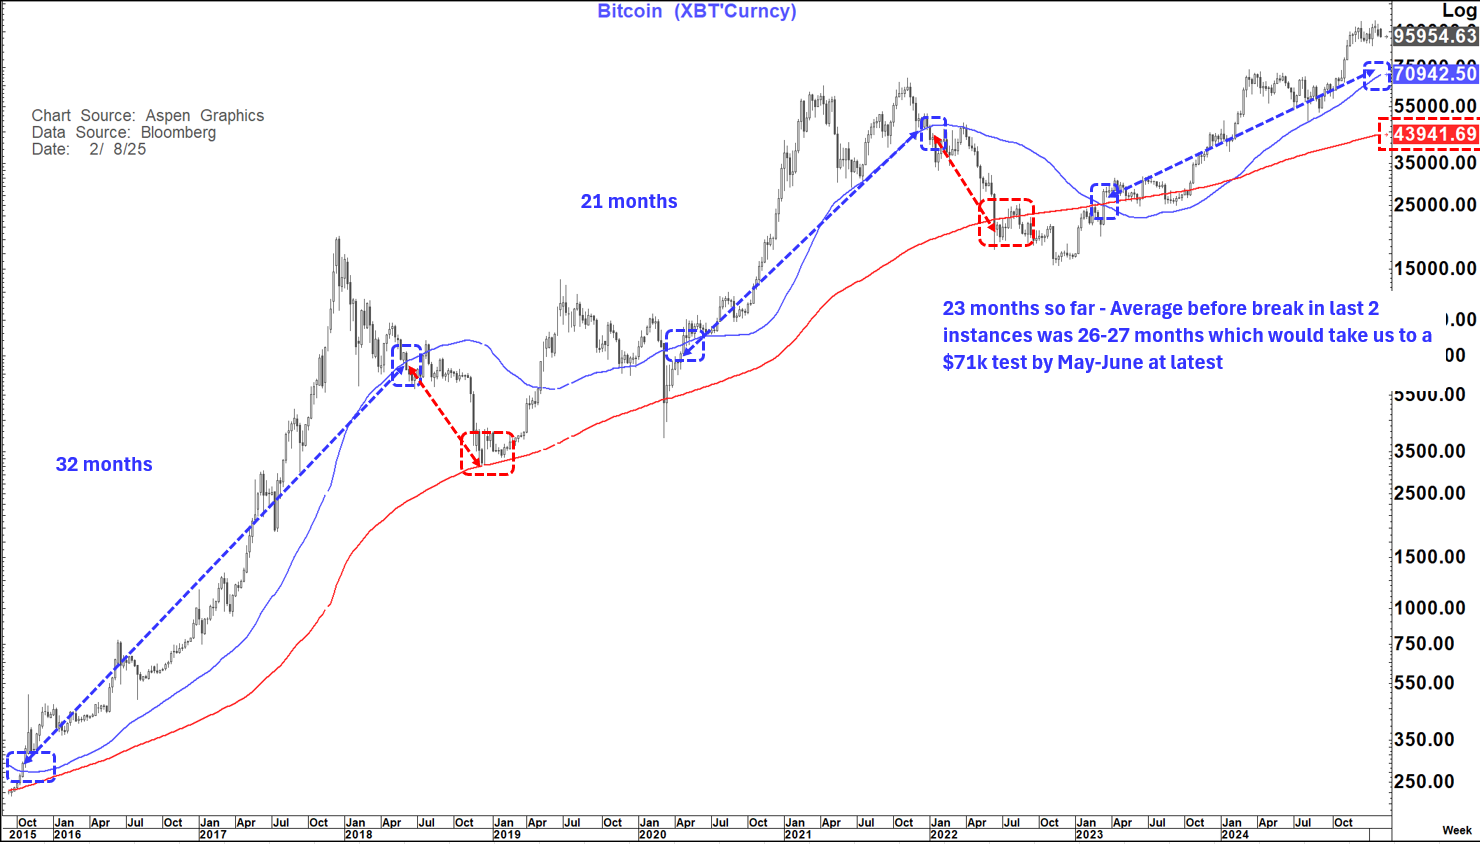
This is not YET an accident that has happened but looks clearly like an accident waiting to happen in my view.
It is also interesting to look at this overlay of Bitcoin and the SOX (Philadelphia Semiconductor Index) during those prior 2 periods.
When we saw Bitcoin fall sharply, we also saw a major retracement in Semi's
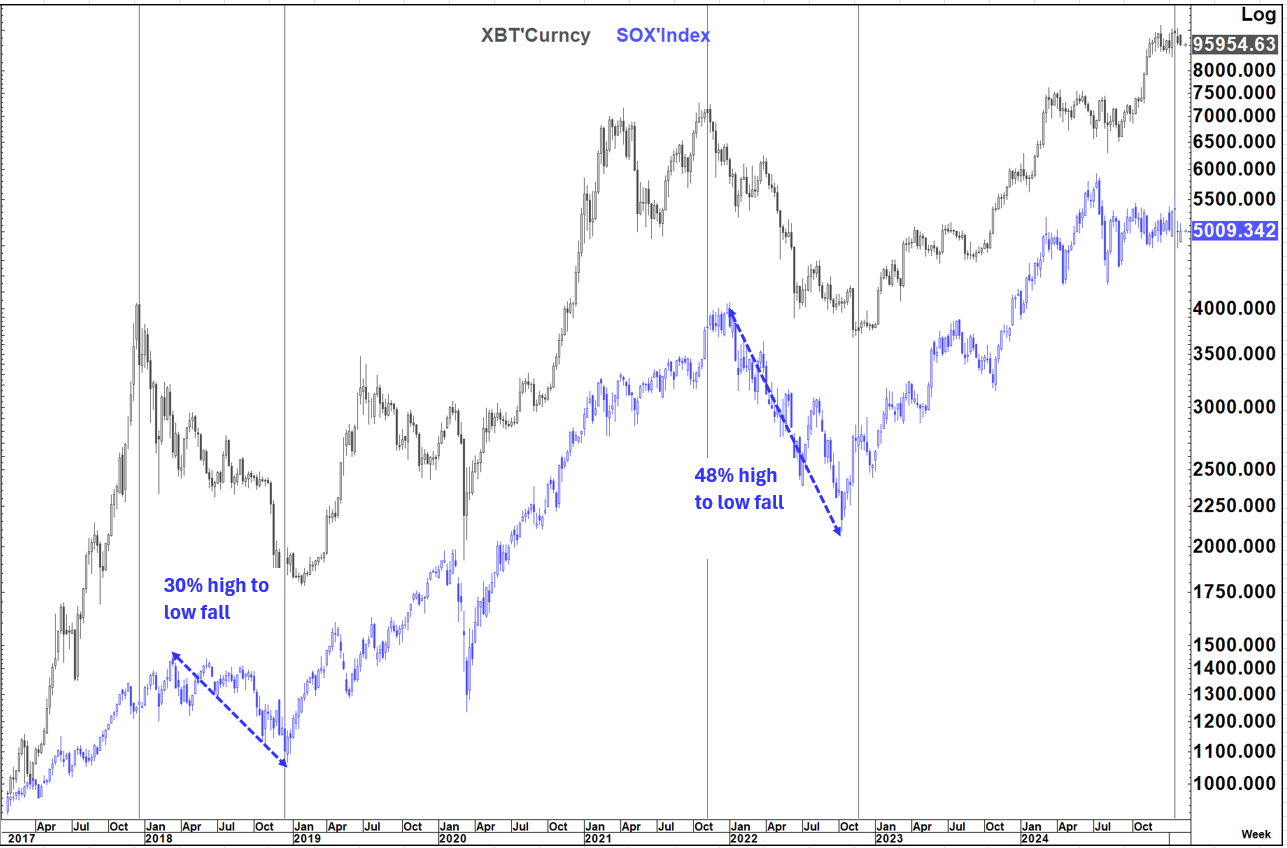
I note this in particular because of a number of technical developments on this index.
At the peak it turned with clear triple weekly momentum divergence
The subsequent bounce posted a near perfect 76.4% pullback before we fell away again in the last 3 weeks
This makes 4,290 a potential acceleration point if we were to test it and break below
On Friday for the first time in 25 months we closed below the 55-week MA despite the recovery from the Sunday meltdown. This after being very stretched to the 55-Week MA at the peak and opening up a very wide 55-200 Week MA gap.
This weekly close suggests we could fall as far as the 200-Week MA and with this setup that time frame is often looked at as possibly 3-4 months (May-June)
The 200-week MA is presently at 3,723 and the slope suggest that in May-June it could be around 3,900 to 4,000 which would equate to a drop of about 33% to 34% from the peak.

Unlike with Bitcoin we have already had a weekly close though this pivotal level (55-Week MA) suggesting that the move lower may have already begun.
IF so, given the feedback loop this creates back into the NASDAQ, S&P and MAG7 charts
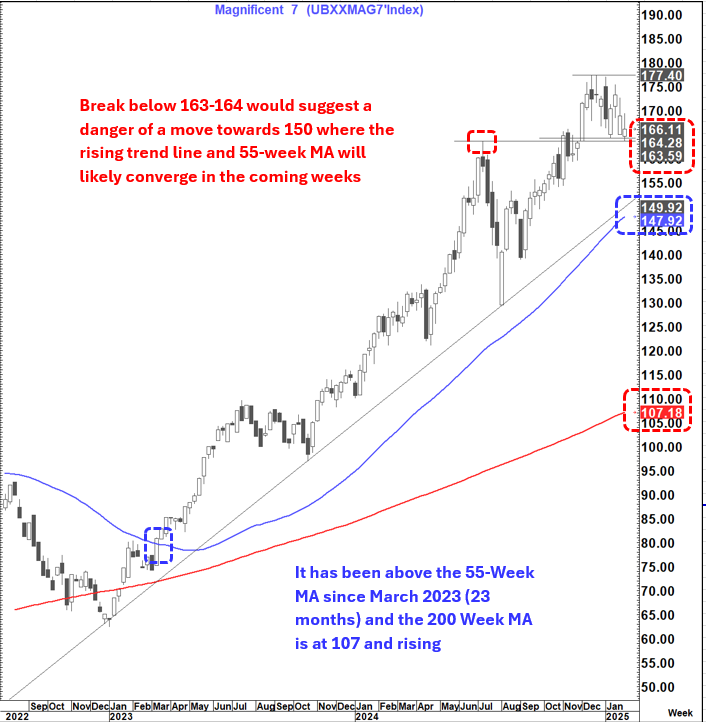
The MAG7 weekly chart also looks interesting here
Charts like these continue to make me question the scope for a higher move in US yields from here despite the "positive" Friday data.
They also support the very negative setups developing on a lot of JPY cross charts which look like they could head materially lower. I particularly like EURJPY, CHFJPY and GBPJPY in that regard
Quite a number of US Equity indices also posted bearish outside days on Friday (Es1, NQH5, SPX, NDX, CCMP, SOX and MAG7 to name but some.)
All this seems to suggest maybe some "risk shock" coming. If so, that would support further moves lower in yields, JPY crosses , Bitcoin and Equity markets but potentially make the Copper chart (despite how well it looks) look like a bit of a "Conundrum"- but that could also be a timing thing.
Most importantly this note is a heads up to say that too many charts are flashing potential warning signals tghat could develop into something that will be hard to ignore.