
The anticipated short-term USD weakness finally materialised overnight as we see FX and other markets continue to follow the January 2017 path for now. It is far too early to look at this as being a sustained multi-month move but in the near-term it looks like some of these moves can continue. in that respect the bias is for
- A lower USD
-Higher JPY crosses
-EURO outperformance
- A stronger MXN
- Higher Gold
-Higher equity markets
- Lower yields and potentially lower Oil prices
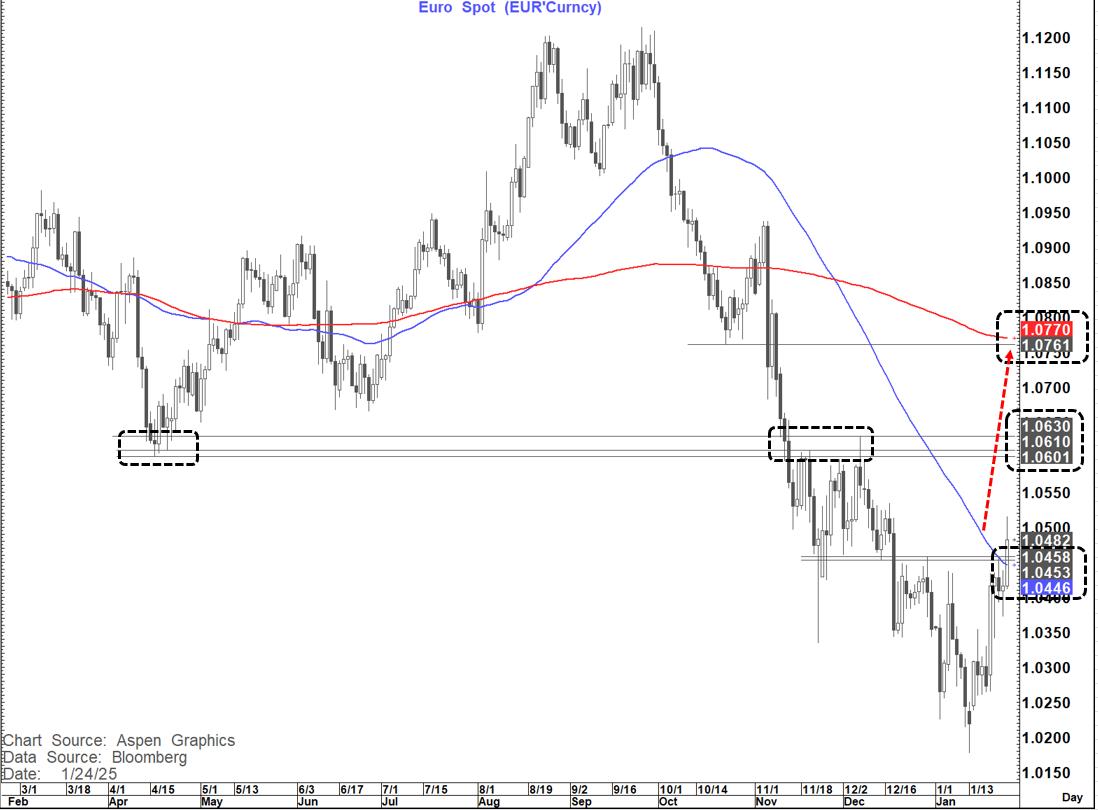
EURUSD has broken above resistance at 1.0446-1.0458, including the 55-day MA at 1.0446. IF we close above this range it would suggest further gains to the topside with first targets around 1.0630-40
The 55-200 day moving average setup (one of my favourites) where it has been below on a closing basis for over 3 months, opened up a wide gap to the 55-day MA at the low and opened up a wide 55–200-day MA gap suggests the possibility of an even bigger move= possibly towards 1.0760-70 where we see horizontal resistance and the 200-day MA
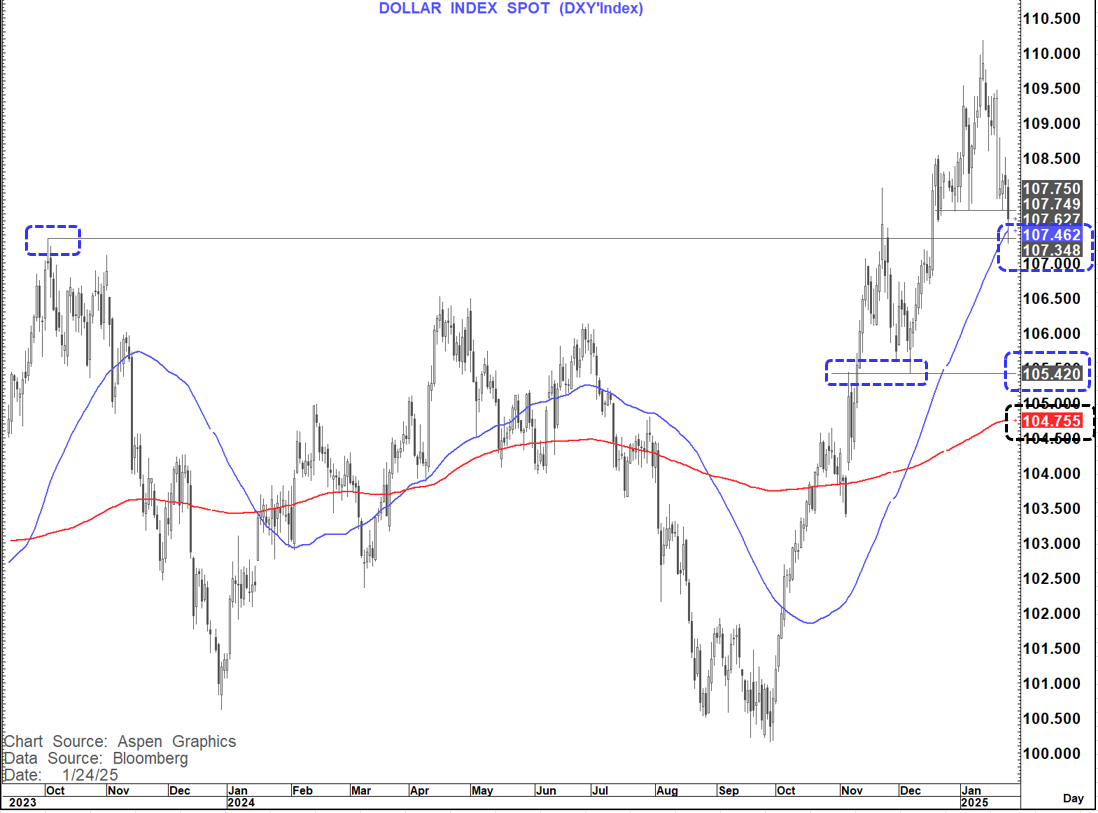
The USD-index is also on the cusp of a break with a few near-term levels still needing a break for confirmation. We are below the recent supports at 107.75 but still have the 55-day MA at 107.46 and the breakout area at 107.35 to overcome.
A close below that range would open up for a move towards 105.40 and possibly the 200-day MA at 104.75
The USD looks pretty soft across the board with GBPUSD also back above 1.2350, NZDUSD above .5693 and AUDUSD above .6302.
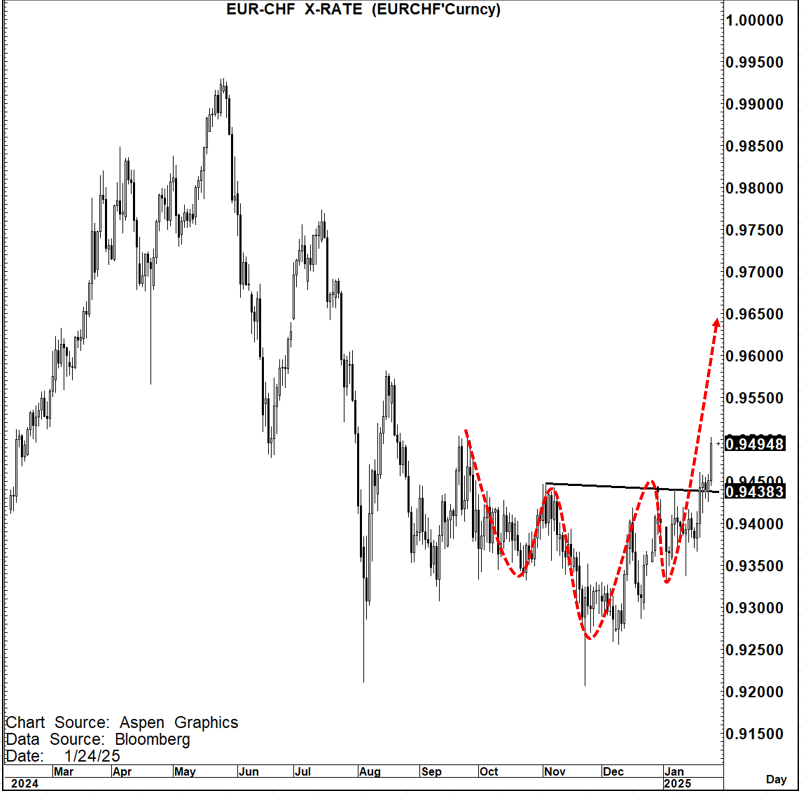
However, when we look at EURGBP, EURJPY and EURCHF they still look bid suggesting the EURO could outperform here. In particular EURCHF has a clear inverted head and shoulders that suggests a move towards .9650
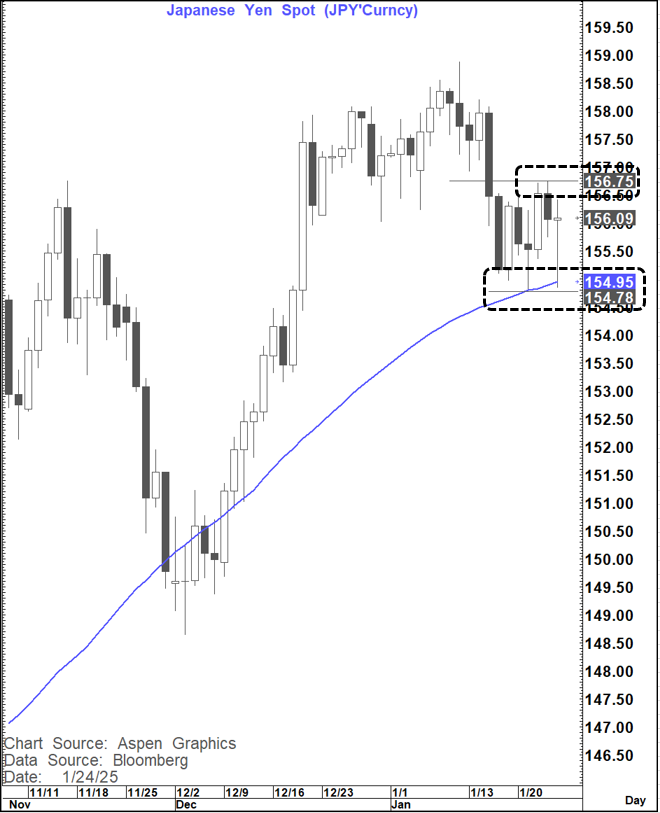
USDJPY is interesting because it is now just above last nights close despite the (expected) BOJ hike. This with a pattern that has now held the 55-day MA twice and could be a double bottom. If we were to see a close over 156.75 that would suggest we could rally towards the January highs again. While the bias is still for lower yields short-term the bias is also for a higher equity market i.e. positive risk parity/risk trade. At the margin that is likely more positive for USDJPY but more importantly for the JPY crosses.
Both EURJPY and GBPJPY have possible bullish outside days today If they close over 163.13 and 193.01 respectively.
As noted above the favoured cross in that respect would be for EURJPY to see further topside gains.
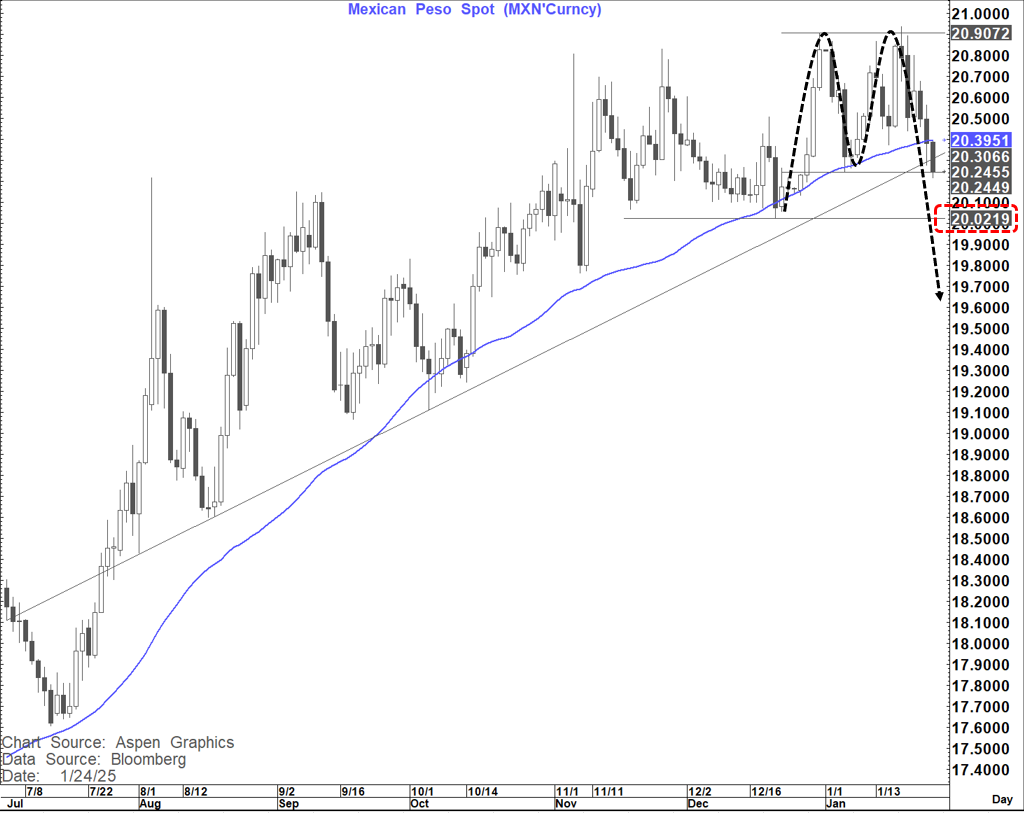
In local markets the most interesting chart has to be USDMXN which is clearly trying to complete a double top at the high of the up move.
This would be confirmed by a close below 20.245 and suggest a target around 19.60. It has also moved decisively below the 55-day MA.
Interim support is met at 20.12 and if that were to give way on a monthly close basis it would be a bearish outside month at the trend high further supporting the bullish MXN picture.
Given the high yield dynamic all this also looks supportive of a long MXNJPY trade
While some commodities have bounced a little today (Copper and Oil) the moves have not been a material development.
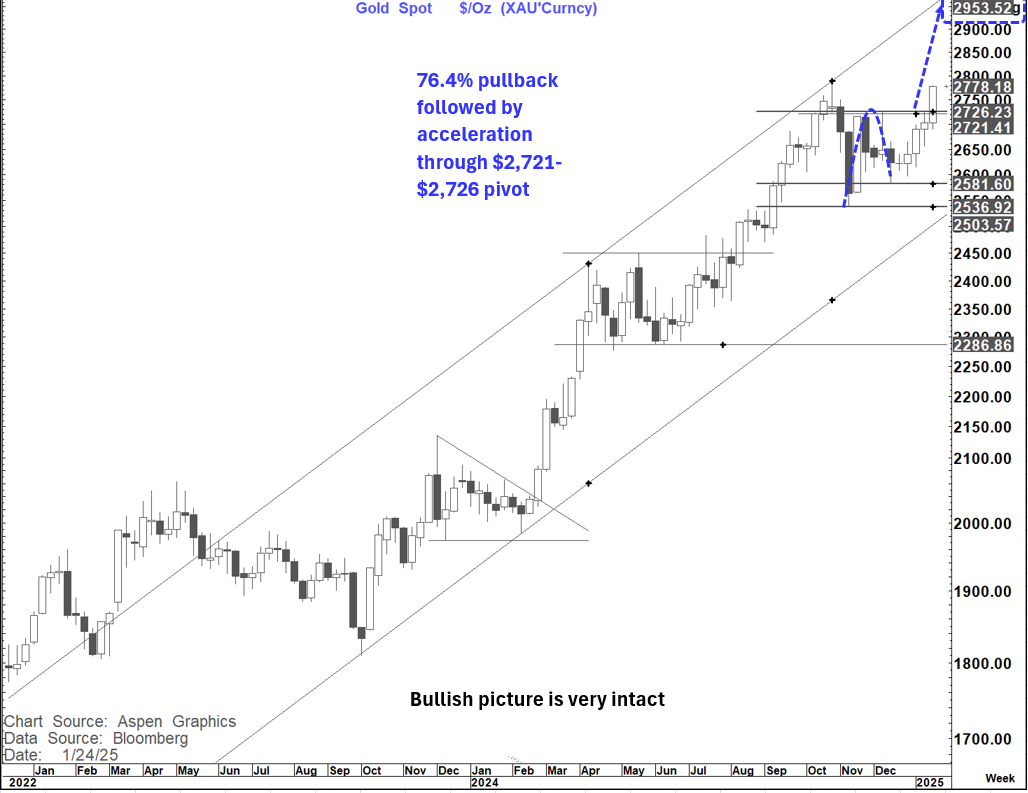
However, the picture on Gold remains very constructive as it accelerated higher after the break of $2,721-$2,726. The minimum target remains for a test of the all-time high at $2,790 but I am biased to think that we could head higher still to $2,900+
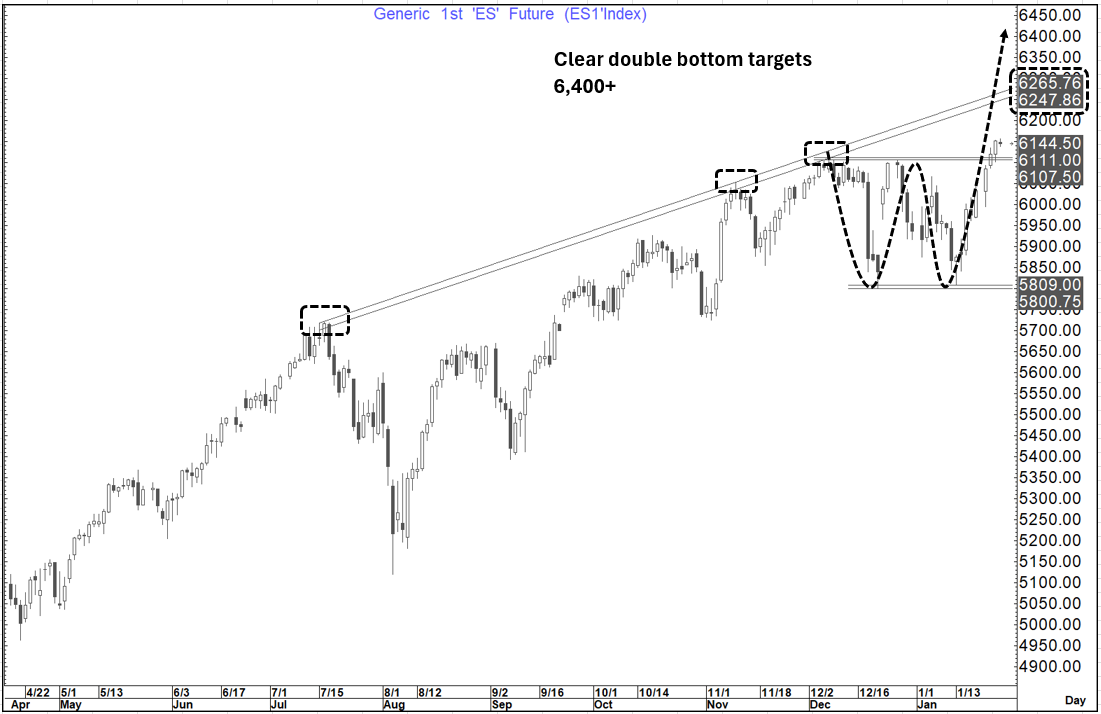
Equities remain in a bid environment, and we seem to have a clear break on Es1 which suggests a move towards 6,400+ (Similar dynamic to Q1 2017) with interim resistance around 6,250+
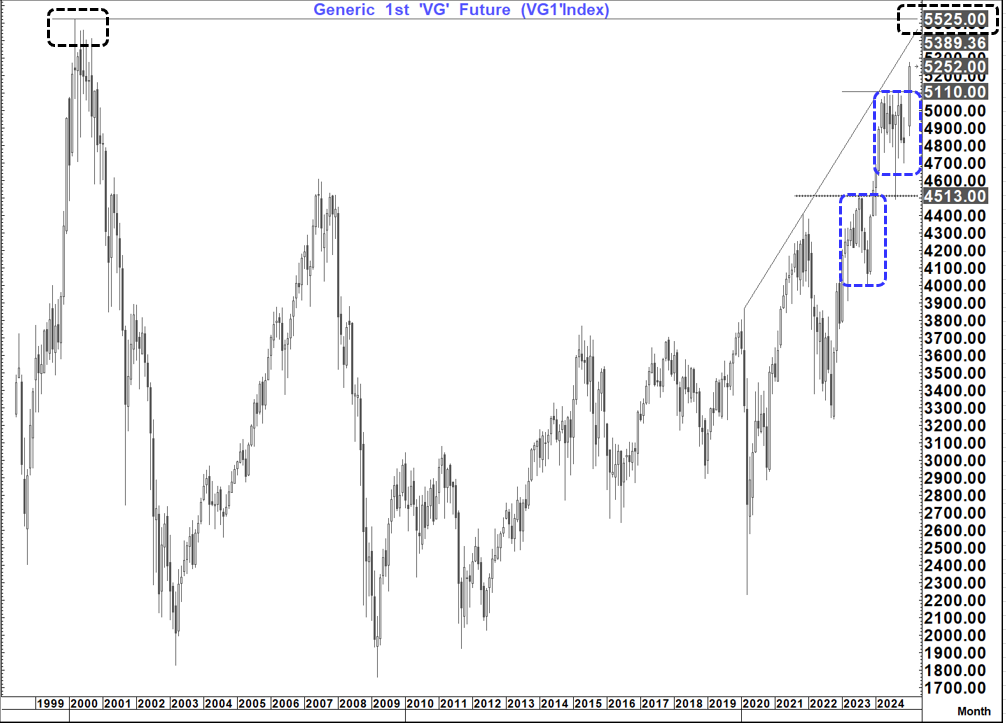
But it is not just US markets. The Eurostoxx 50 has made a clear breakout that suggests at least a return to the 2000 peak at 5,525 if not more
My short-term bias on US yields is still lower with the longer-term bias of higher yields still intact (for now at least)
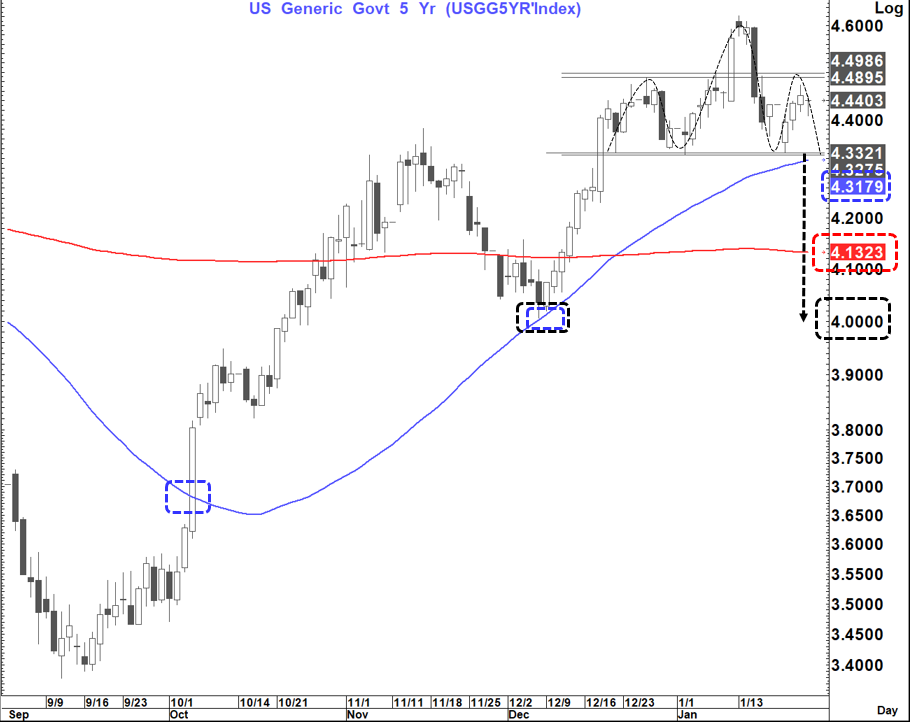
The chart I am presently watching most closely is the US 5-year yield which is "attempting" to form a head and shoulders top and also has a 55-200-day MA setup of interest.
The neckline of the potential head and shoulders top is at 4.33% while the 55-day MA is at 4.32%.
The head and shoulders, if completed, would target a move towards 4% with the moving average setup having a more conservative 4.13% target (200-day MA). 4.15% is also a 76.4% retracement of the 4.0% to 4.62% move
If we start to regain the 4.49-4.50% range this may start to look less like a head and shoulders top and temper this potential.
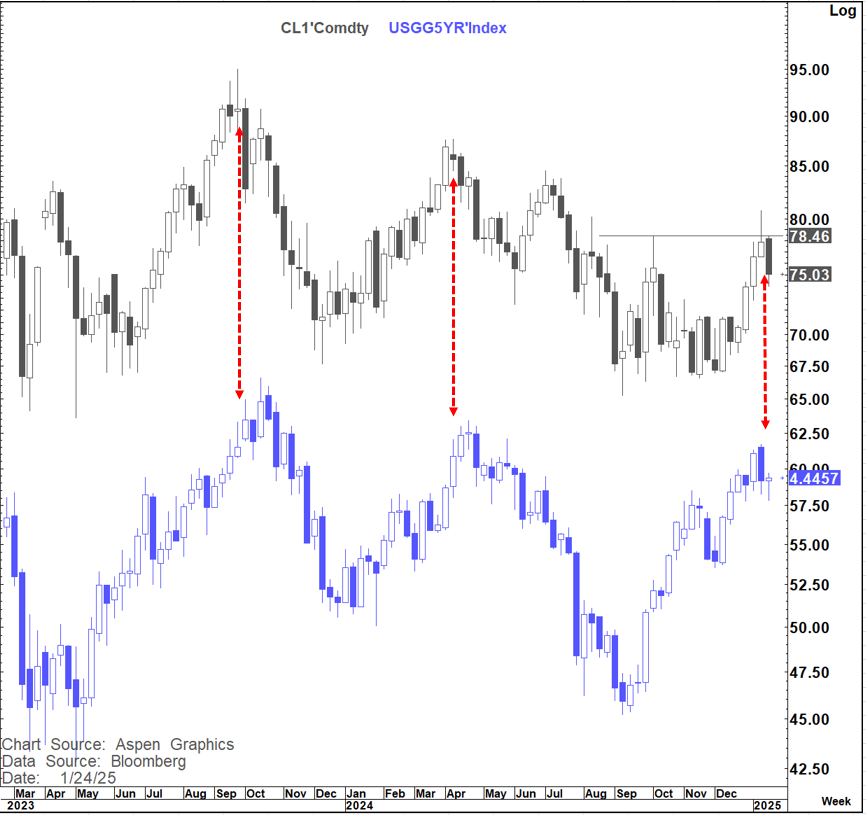
One thing very much worth watching in this respect is the Oil price. last week WTI failed to sustain a break of the pivotal $78.50 area and has since turned lower. If this turns out to be a top and we keep heading lower recent history shows that this could weigh heavily on yields.
All of the above (if it plays out as indicated) would suggest that "rumours of the demise of the "risk parity" trade are greatly exaggerated.