
The big standout to me today is some of the moves developing on Commodities and their potential feedback loop to other markets
In a nutshell higher commodities (Oil, Copper, Gold) look a danger as well as much higher yields (unless and until things break), steeper curves, a higher USD and lower JPY crosses, lower Bitcoin and potentially lower equities look a danger as the Fed comes to a dead stop and has to wonder which way the next move may actually be.
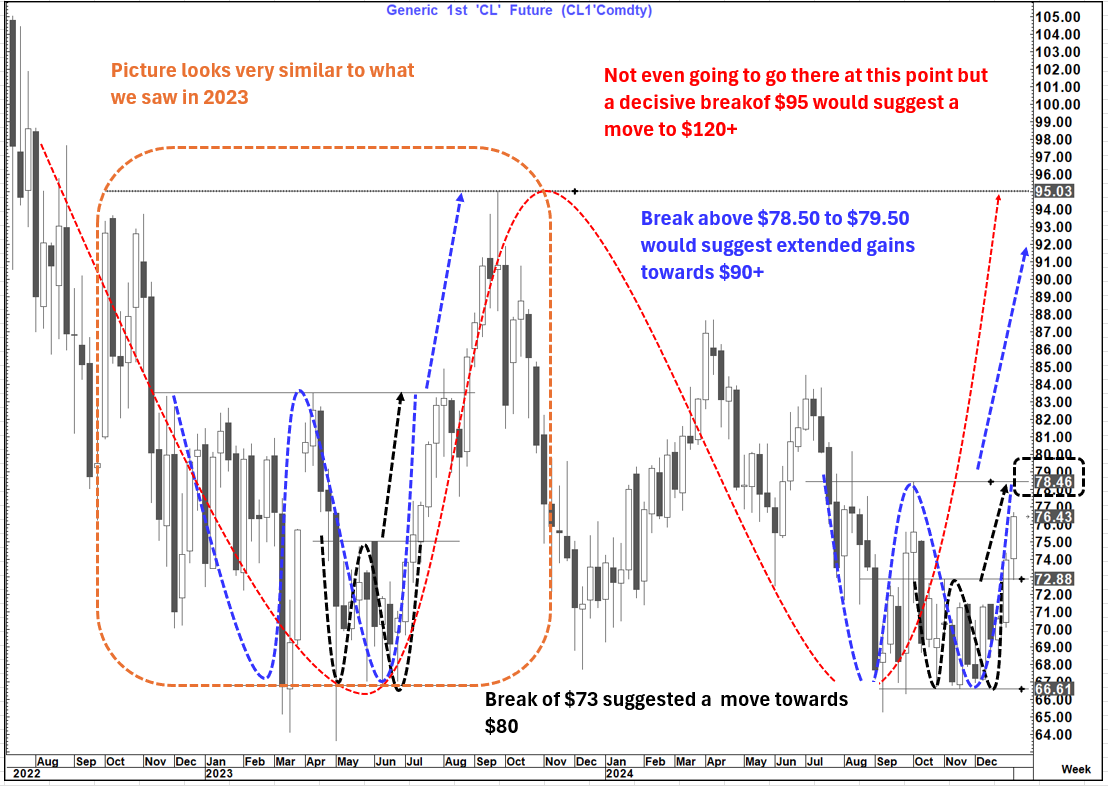
Firstly, the Oil price.
WTI has surged this morning and reached the first double bottom target around $76. However, in making this move it has already completed a second double bottom that suggests a move towards $78.5 to $79,50 which is now the new target.
What If we get there? What then? While for another day, there is a real danger that if CL1 breaks above $78.50 we complete a 3rd double bottom ($79.50 on CLH5) that would target a move as high as $90+.
This is important in 2 respects:
The initial knee-jerk reaction at the long end of the curve to a sharp move higher in Oil prices is higher yields which is what the long-term US 30-year yield chart is strongly suggesting .
The short-term chart has failed to complete a short-term bullish picture and today looks like it could be its last chance. Absent a poor employment report it is very hard to see a catalyst to now stop this bearish break on the long end above 4.825% to 4.845%.
****Still writing and the employment data has just come out. Simply put...strap in....there is absolutely no bullish catalyst left for fixed income. This could get ugly*****
This break suggests not just a return to the prior high at 5.18% but likely a move as high as 5.75%
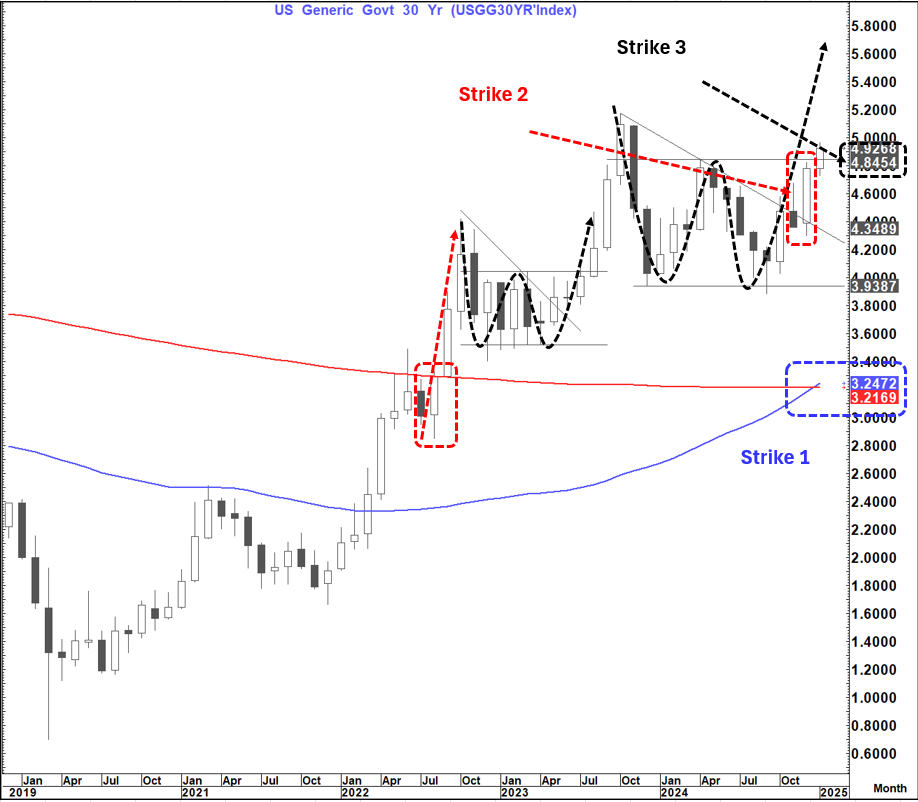
As mentioned before, this break on the 30-year yield is "Strike 3"
Strike 1 was the cross of the 55-month moving average over the 200 -month moving average with both upward sloping
Strike 2 was the outside month to the upside last month for the first time since August 2022. That outside month saw a low to high move over 3 months of 157 basis points. A similar move here would give us 5.86% by end Q1, 2025.
This move, if it happens, would almost certainly see aggressive curve steepening as there is no way the Fed is hiking in Q1. This should make it difficult for the 2-year yield to sustain outside of the 5.25%-5.50% fed funds range with any consistency.
The 2's 30's curve already met and exceeded the initial target of +55 to +60 basis points but the long-term target is much higher at around 125 bp's.
Let us surmise that we get there, and we get to 5.75% on the 30-year yield. that would leave the 2-year yield at 2.5% as the Fed sits on its hand and watches this play out. I also think this could move us into the territory of "something breaking" with the equity market being the more obvious casualty.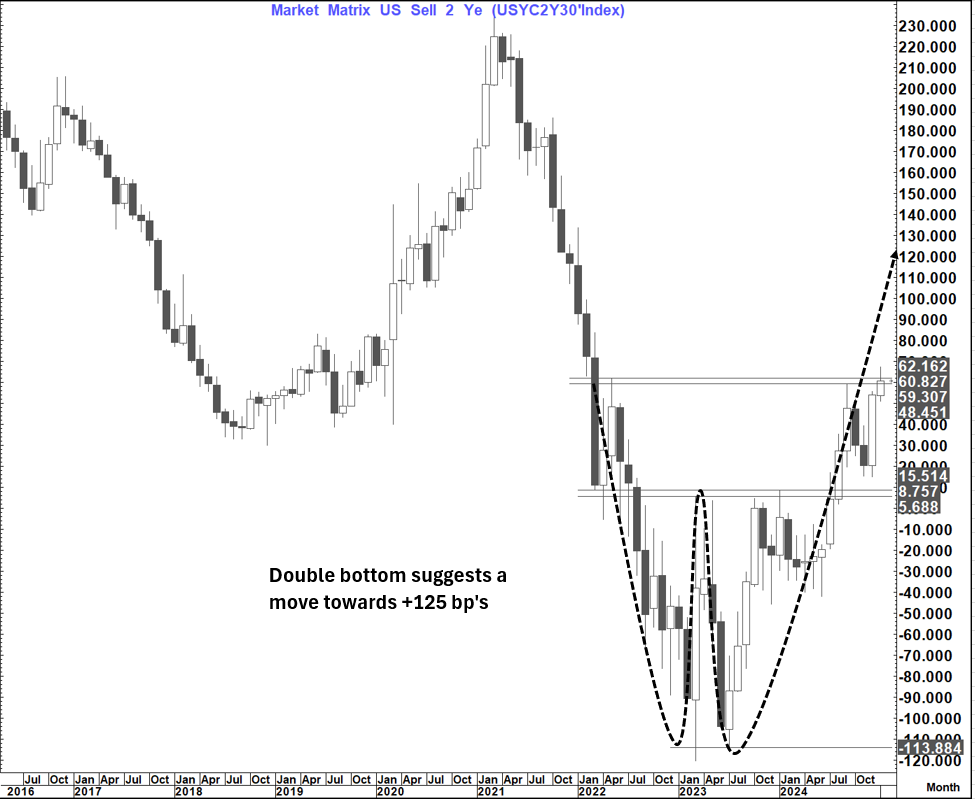
But it is not only Oil that is looking more bullish.
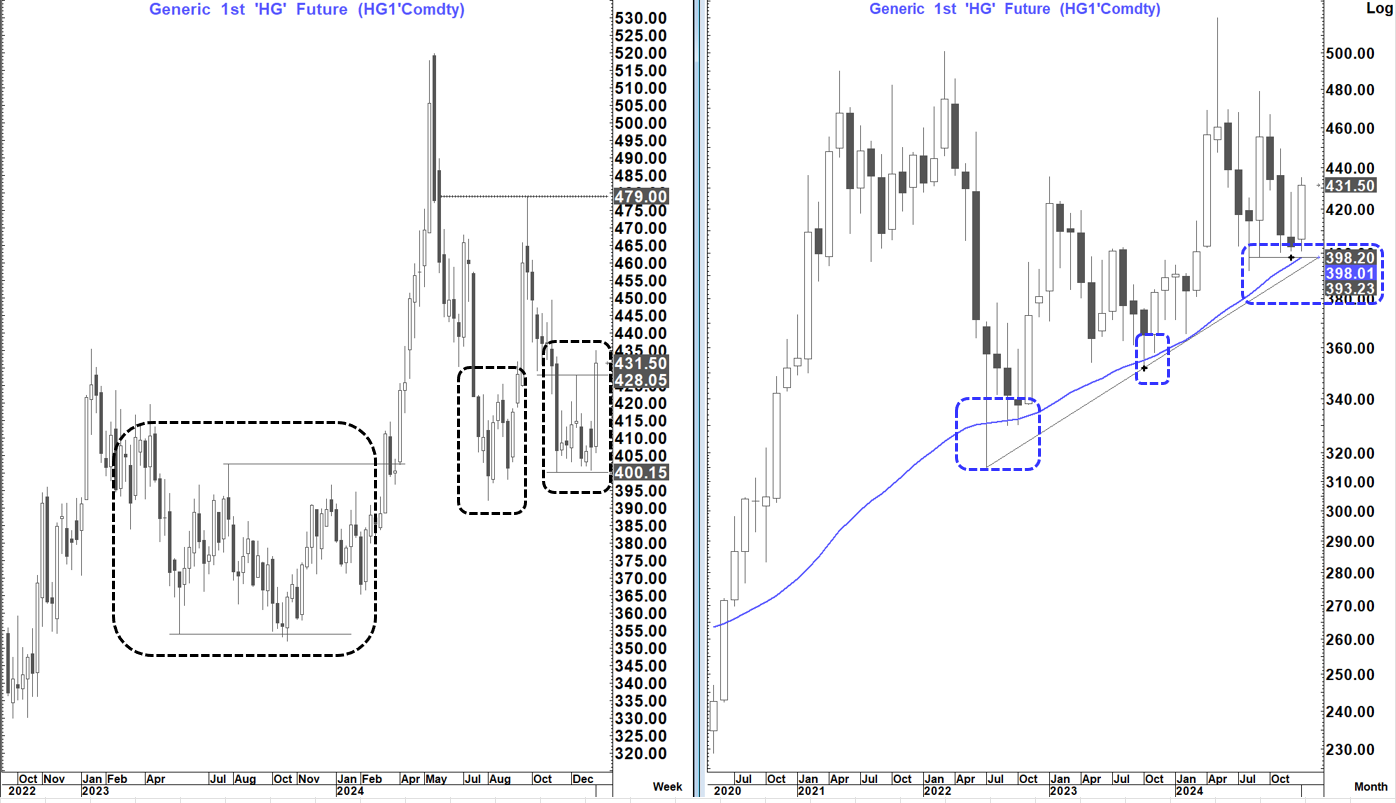
Copper (Hg1) has an increasingly positive technical setup.
On the weekly chart it has completed a clear double bottom which suggests a move towards $455+. this is similar to what happened in September last year when it rallied up to a peak of $479 (when long-end yields started to push materially higher) as well as in March last year (another period that saw rising yields.
Like Crude, IF $479 gave way we would have an even bigger double bottom that would suggest a s high as $560.
On the monthly chart we also turned from above rising trend line support and the 55-month moving average which has contained all corrections lower back to 2022.
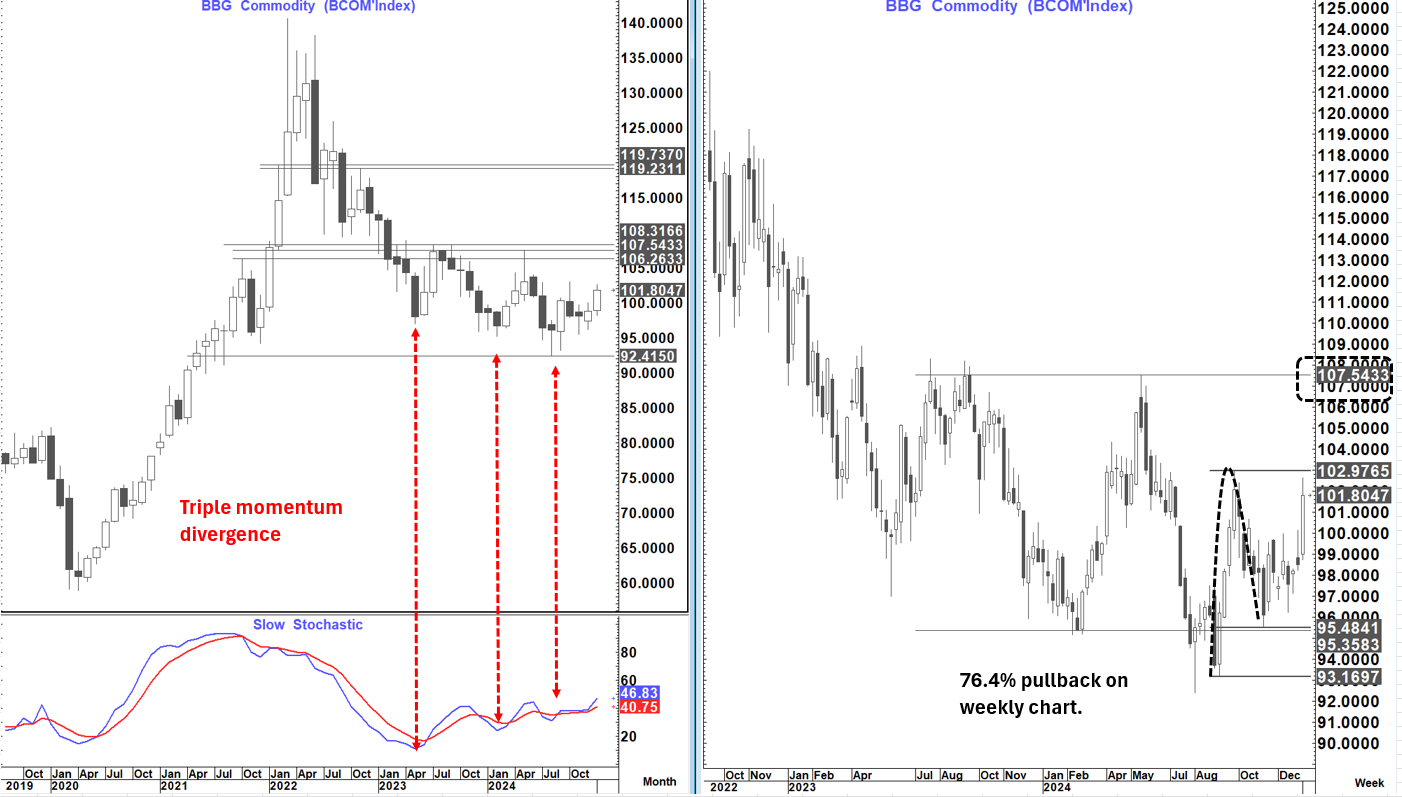
This is all bring the long-term Bloomberg Commodity index (BCOM) back into play
Back in August/Sept I noted a big technical development on the monthly chart- Positive triple momentum divergence (one of my favourite indicators and very material on a monthly chart). Not a lot happened since, but the price did drift higher over the subsequent period by about 10% (10% is not a big move on a major monthly technical development) but the chart is getting more interesting
On the weekly chart we have a 76.4% pivot at 102.98 which we are approaching and a break above opens up for a test of good resistance from 107.54 to 108.32. Above there is open territory and would suggest at least a move towards 120 is on the cards
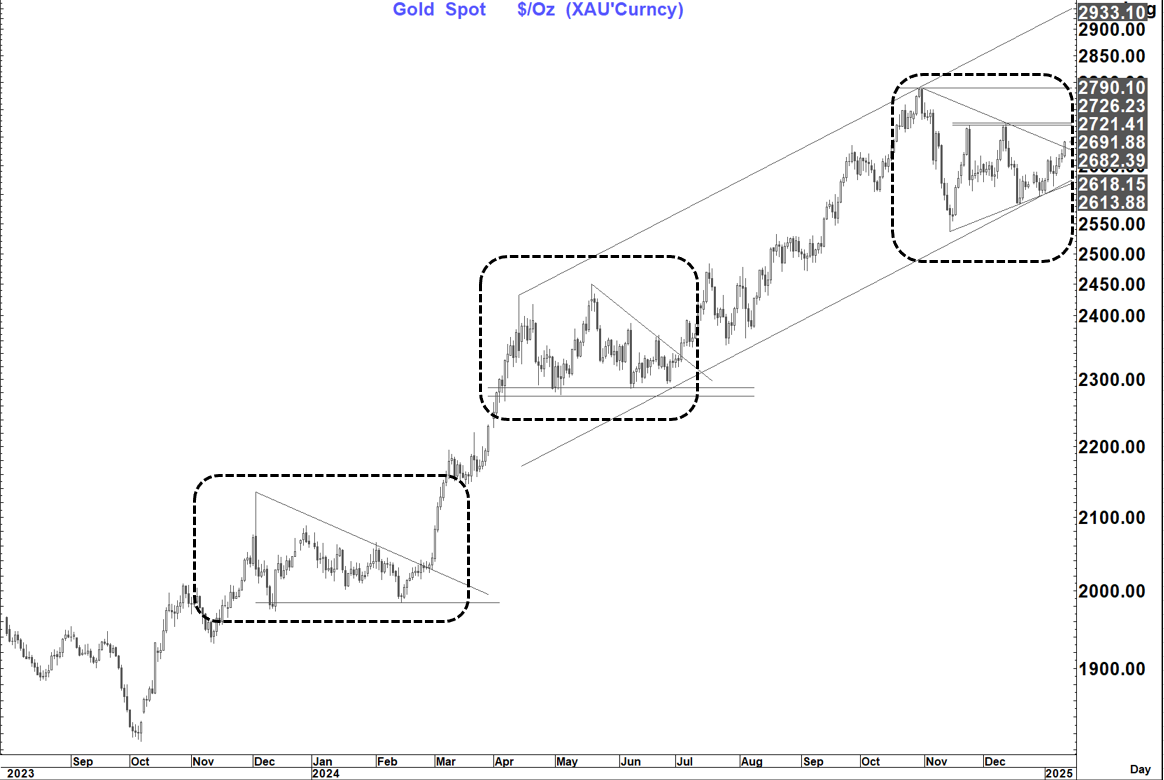
Is Gold sniffing this out?
Gold is going bid against a strong USD with yields going higher- a clear indication of structural strength.
It is once again starting to behave like a risk hedge and an inflation hedge.
It is also now starting to look like a triangle consolidation and breaking out suggesting a return to at least good resistance at $,2721 to $2,726 and above there the all-time high at $2,790.
However, I would not be surprised to see that break also and open up for a move to the channel highs around $2,930.
With the USD looking bid and the UK looking in all sorts of problems, however, my favoured Gold long is against the GBP.
Bitcoin continues to trade more like a risk asset than a risk hedge and if equities stay under pressure, it could be susceptible. So far supports are holding but IF we break below the $90,742-$92,143 area it will look like a bit of a trapdoor and set a "gut-wrenching fall" towards $73k to $76k. It needs to regain $100k-103k to setup a more bullish looking picture again but in this present early 2025 risk averse backdrop the downside supports seem to be the ones that could come under pressure

Equities are also shaking in this backdrop- likely the only thing that might temper the rates move if they keep falling. However, in that instance the USD likely remains bid as a "flight to quality" and JPY crosses stay under pressure. In that instance short GBPJPY would be my favourite expression with a minimum target of 188 and possible extension to 180.10-181.25

So, on the equity market.
Firstly ,we need to get something clear. The Fed is not reacting anytime soon to Equity market weakness unless the fall becomes much larger and destabilising. That could happen but we are not there yet. However, sharp intraday falls like today could temporarily temper the bond market moves but are unlikely to reverse the trend.
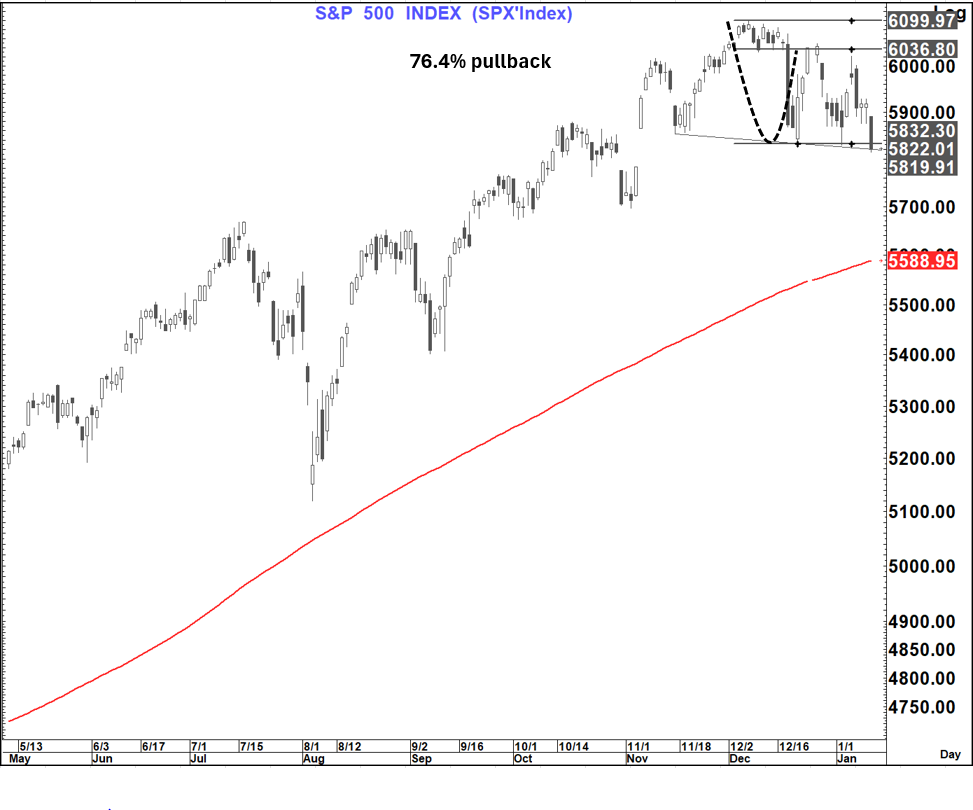
How does the S&P look right now?
The SPX is actually right on the cusp of some very good supports at 5,820 to 5,832. This after turning off a 76.4% pullback. A close below these levels would break the pivot off which the 76.4% pullback was formed as well as the neckline of what could be considered either a double top or a head and shoulders top.
The target of such a break would be around 5,720 if viewed as a double top and 5,660 if viewed as a head and shoulders. In addition, the rising 200-day MA stands at 5,589. On top of that a close today, if seen, below 5,829.50 on the S&P 500 would be a bearish outside week (5, 874.75 on ESA) which would add to the bearish picture. We also have potential bearish outside weeks on the NDX (below 20,800) and NQA (Below 20,984) and overall setup that also looks bearish
All of this is pretty much the Fed's worst nightmare, and they are again living in yesterday's world. I am just waiting to hear that the move down to 4.1% on Unemployment is transitory, that tariffs are transitory, that tax cuts are transitory, that deregulation is transitory, that renewed sticky inflation is transitory. The don't need to talk about possible rate hikes (yet) and anyway the bond market is doing that for them.
However, they also need to stop talking about continuing cuts like nothing has changed. Everything has clearly changed. Any cuts now will need a deterioration in economic data (particularly employment), further falls in inflation, severe market stress/something breaking.
While that may well come down the line, it is not there now, and the danger is that they are staying wedded to what on the face of it looked a good approach in Q3 last year but now looks sorely outdated.
On a last point- Los Angeles.
While this is just a tragic story and my heart goes out to all those affected- what does it mean for markets?
Losses of $150 billion are now being talked about almost tripling from 2 days ago. This story is far from over and the tragedy, loss of live and dislocation is far from fully calculated.
What does that mean for bond markets and potential supply particularly from Govt. support? What does that mean for skilled labor demand in the World's 4th largest economy? What does that mean for homebuilding and existing housing supply? What does that mean for potential supply shocks and commodities?
I do not have all the answers to those questions but in no instance does the answer come out as disinflation or less inflationary.
I do not envy the Fed's job now because there is s real danger that the only way this will balance out is if things break and it looks like the moves above will likely be needed to create the catalyst for that to happen .