Markets are "at best" very noisy at the moment. Yields continue to chop around but really go nowhere.
Since mid-December there have only been about 7 trading days that the US 10-year yield has not traded on levels in the 4.50-4.60% range.
Possibly CPI sets up for something more interesting after today.
However, elsewhere there a few very interesting charts to look at.
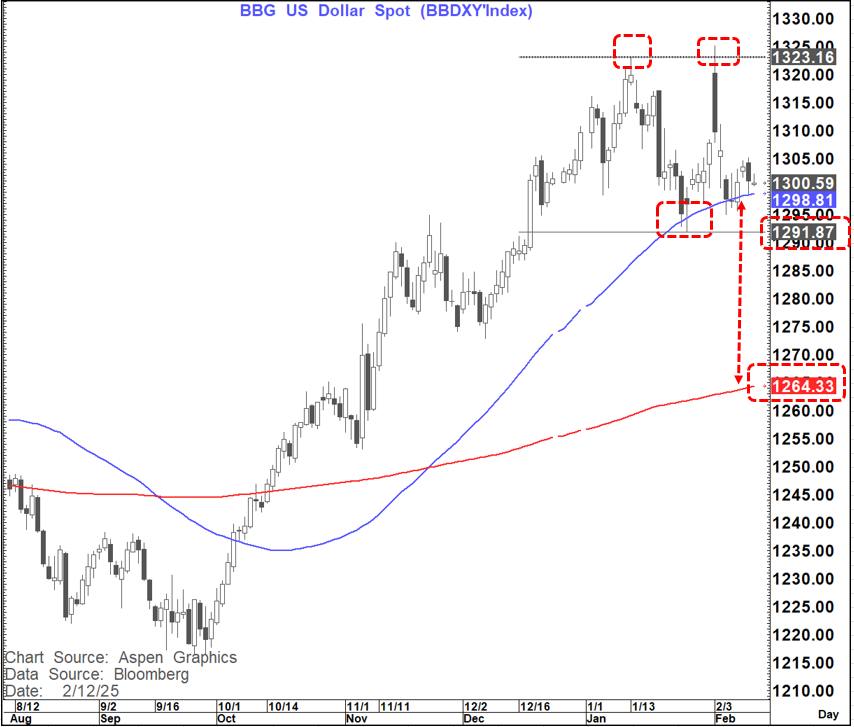
In FX we saw a bullish outside day on GBPUSD and bearish outside days on the DXY-index and the BBDXY-Index yesterday
Of these the chart that looks most interesting is the BBDXY-index
In addition to the bearish outside day, it is testing the 55-Day MA at 1,299 and then a potential double top neckline at 1,292.
A move below this support area, if seen, opens up the way for a move towards 1,260-1,265
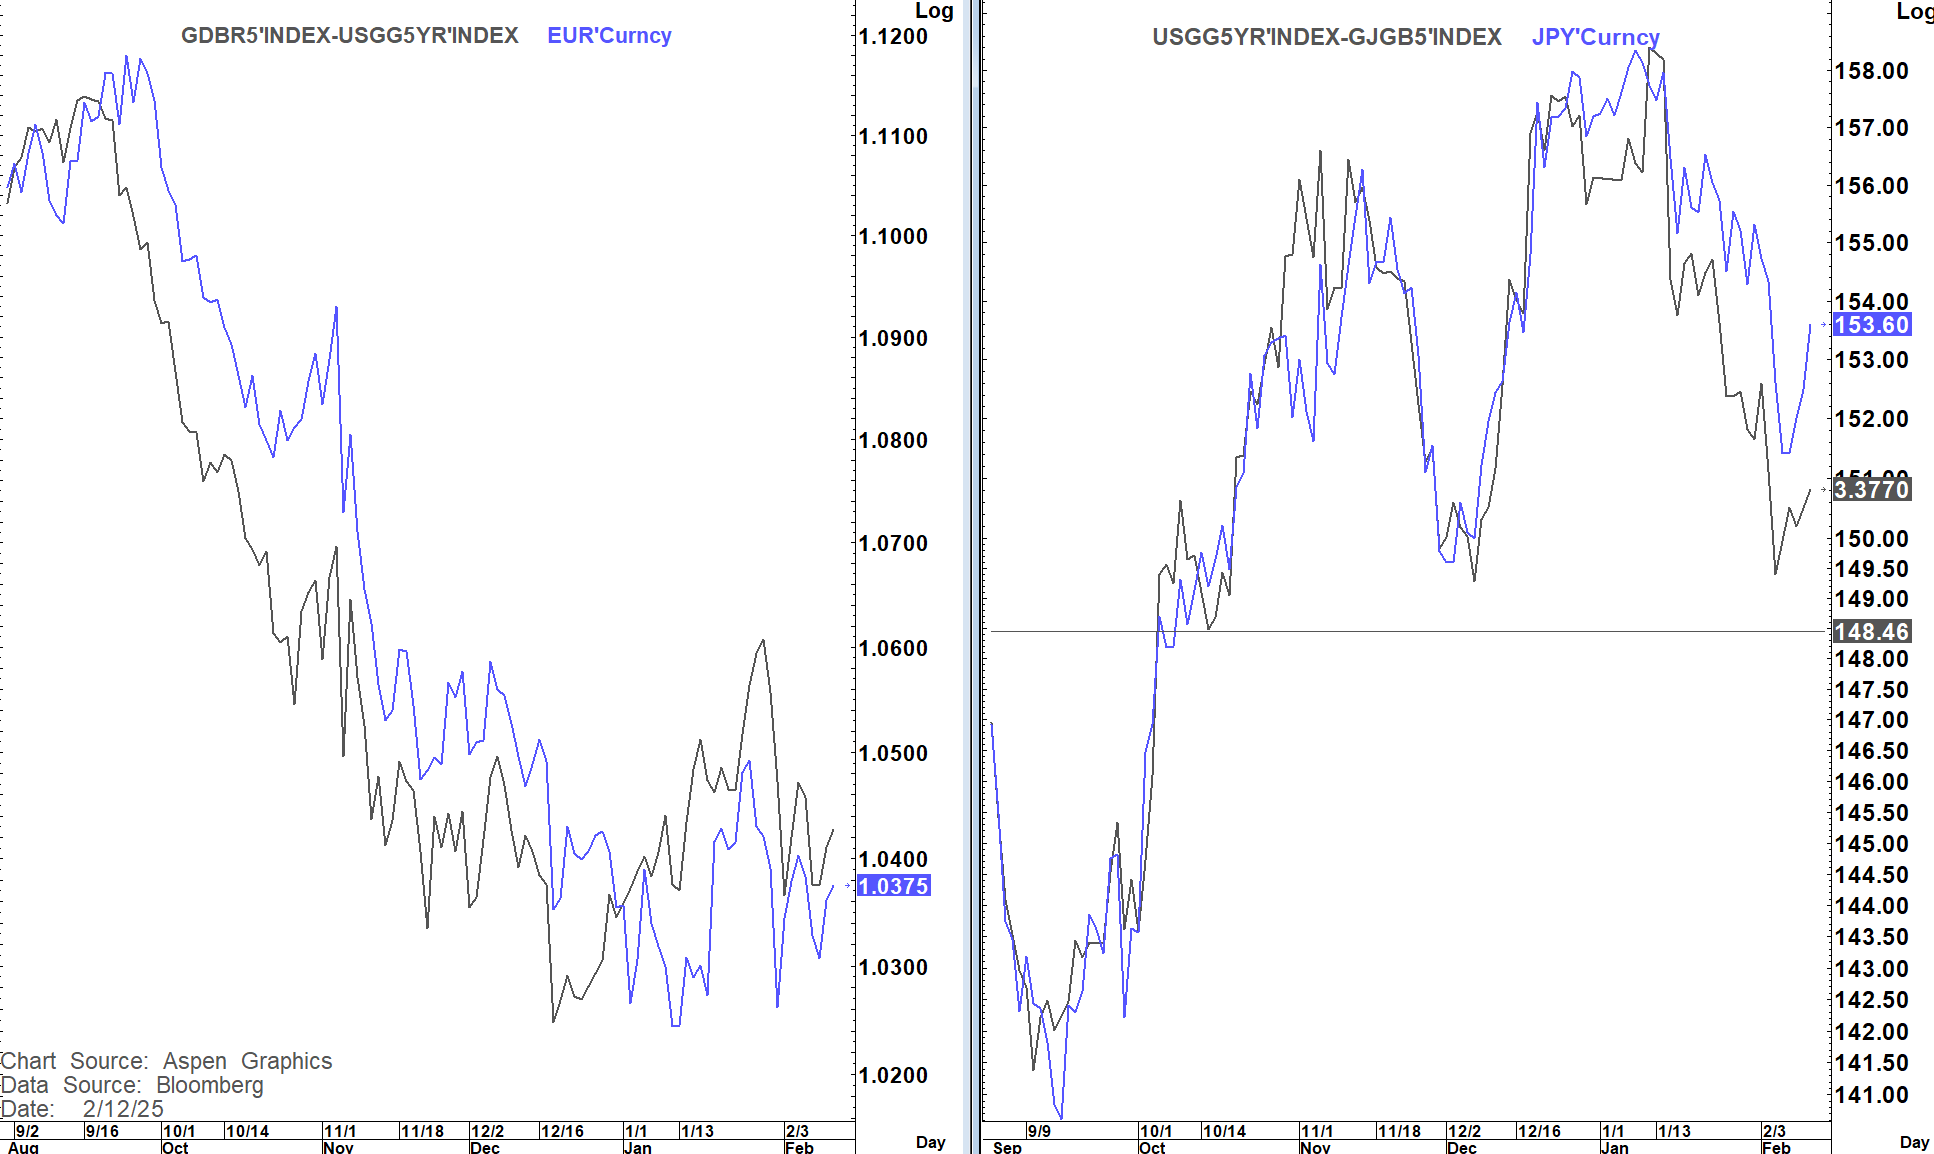
The 5-year yield spread charts on EURUSD and USDJPY suggest that EURUSD is not far off where it should be (about 1.0425) while USDJPY should be closer to 151
One long-term FX chart that looks very interesting is USDCAD
It looks like it might be "Topping and turning" in a fashion very similar to 2016 and 2020. IF it closes the month below 1.4261, we will have a bearish outside month at the high of the 3 1/2 year up move suggesting a major turn with the first target being back to the breakout area at 1.3946-1.3977
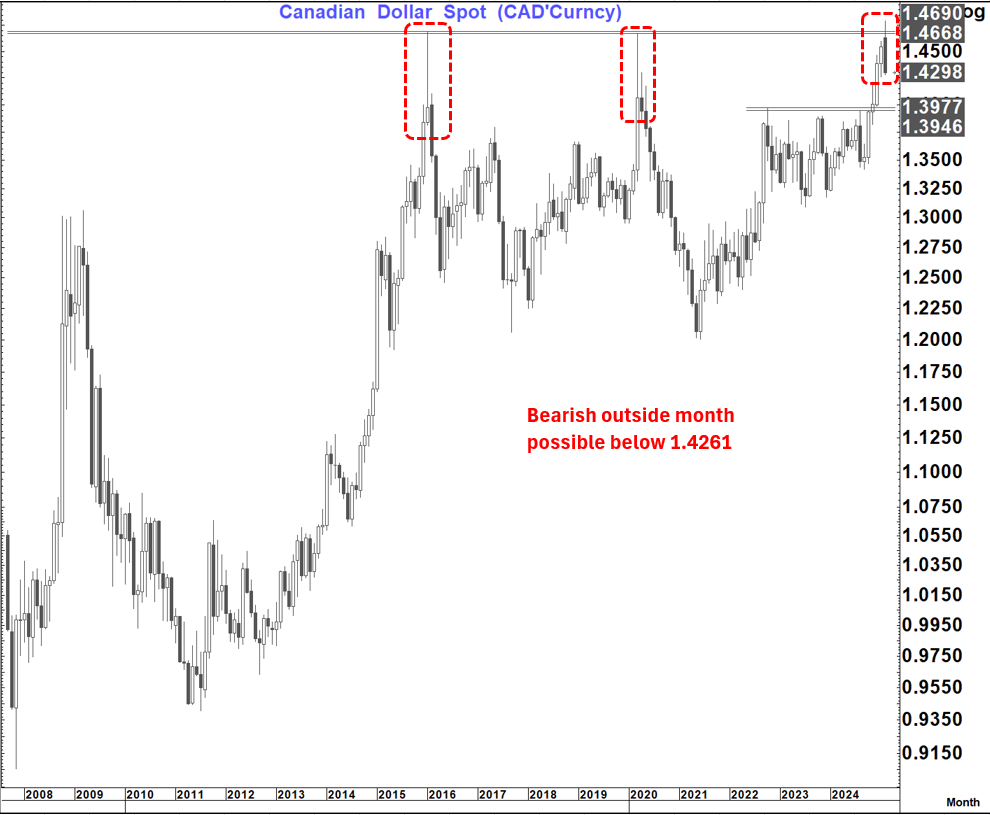
As can be seen in the chart below those 2016 and 2020 turns were not just about USD but were more broad-based USD turns. The overlay of USDCAD and the BBDXY-Index is quite closely correlated
In fact, a monthly close below 1.293, IF seen, would be a bearish outside month at the trend high and also at the 76.4% pullback level. This would potentially suggest much lower levels over time
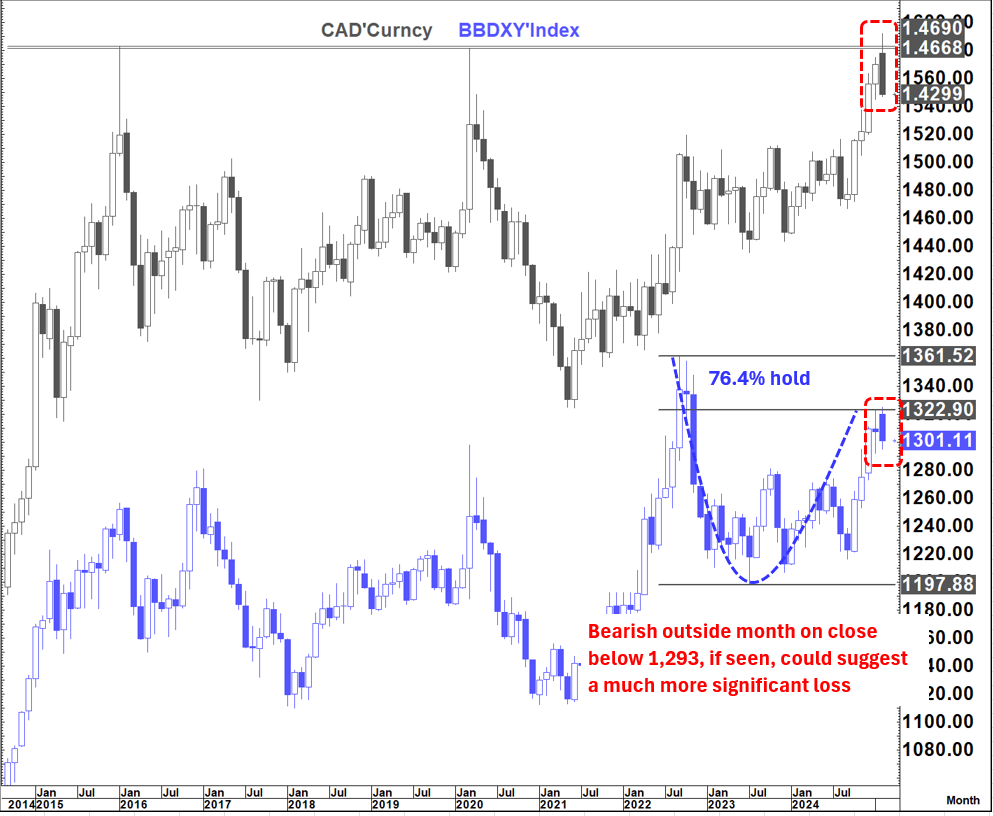
So, we have to at least entertain the idea that we could be on the cusp of a major turn lower in the USD
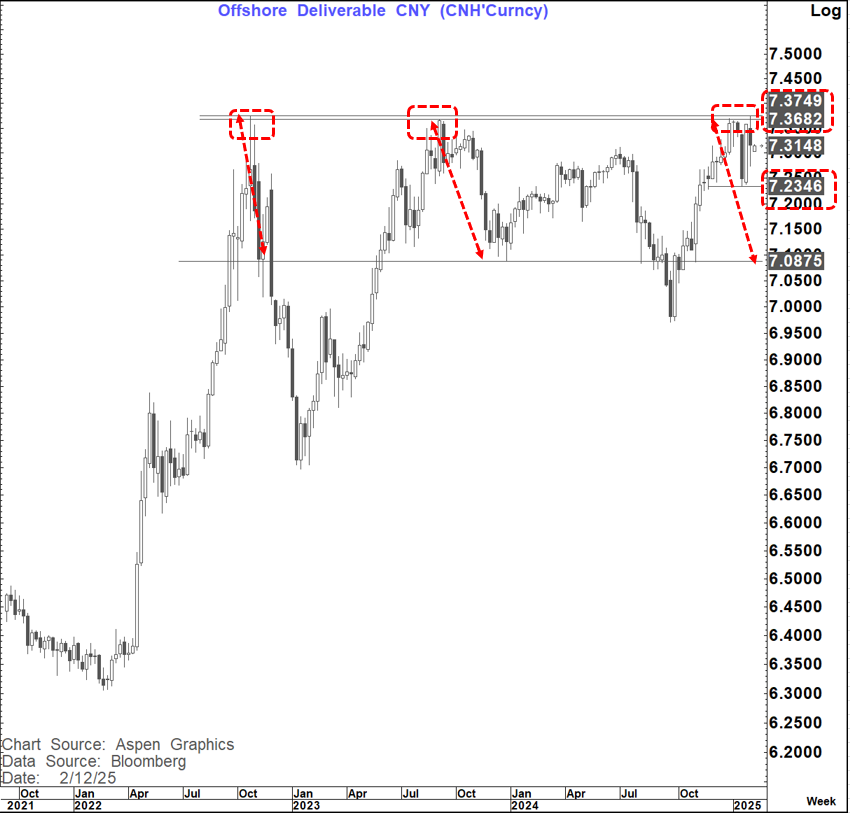
In that respect it is also worth watching USDCNH. The major resistance area around 7.3700-7.3750 looks to have held once again as it did in 2022 and 2023.
In addition, it could be forming a double top with a neckline at 7.2350. A break below there would suggest further losses towards 7.09 again
While anything can happen in markets, it is hard to imagine these moves unless yields spreads continue to narrow against the USD.
Or maybe it is that this whole "Tariff thing" ends up being one tiny "storm in a teacup"
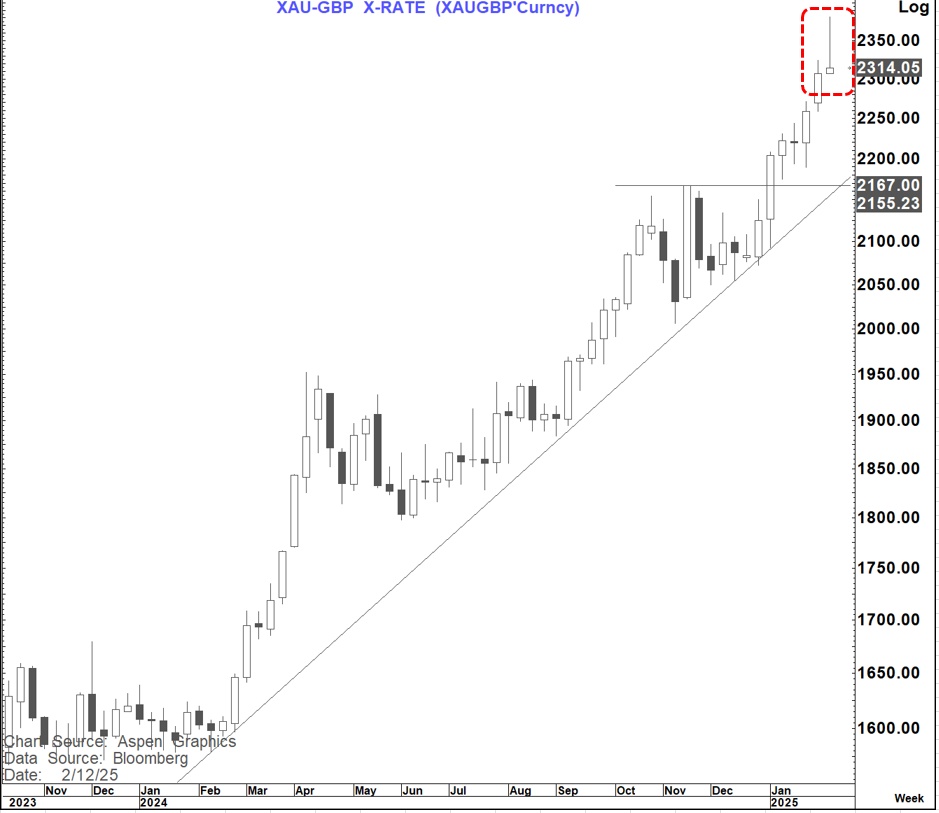
Elsewhere I am a bit more cautious on Gold now. We effectively got close to our $2,950-$3,000 target and reversed sharply yesterday. On one of my favourite charts- XAUGBP we saw a clear inverted hammer at the high of the move and this picture is very similar on a number of Gold charts.
More important the candle on the weekly chart at the high of the trend looks very precarious if sustained for a weekly close. A move back towards GBP 2,150-2,200 would not be a stretch if this happened