These are, in my opinion, the best market charts to watch across asset classes as the week closes
FX
There are 3 standout charts in FX. They are The BBDXY Index, USDCNH and USDCAD
BBDXY
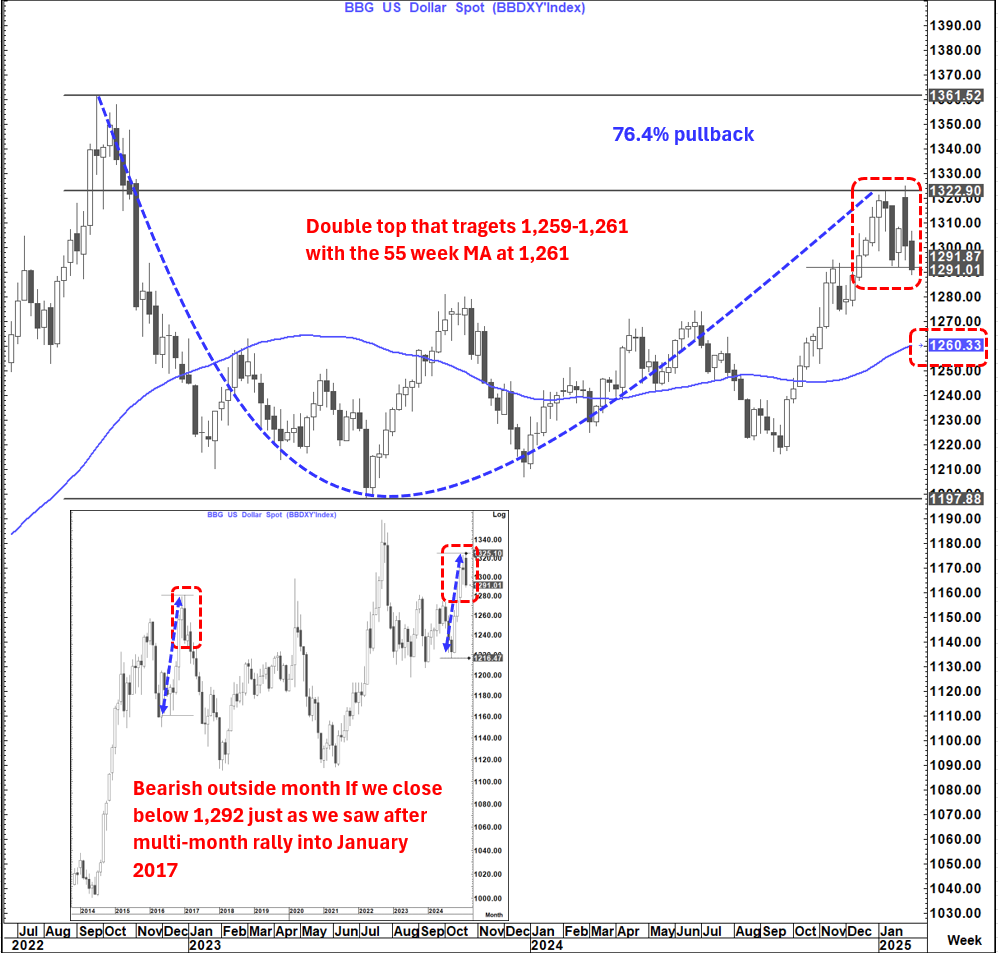
The BBDXY hit a "proverbial" brick wall at the 76.4% retracement level (1,323) and reversed sharply lower.
Now, IF, it closes below 1,292 today it will complete a double top that targets a move towards 1,259-1,261 with the 55-week MA at 1,261
In addition, a monthly close below 1.292 would be a bearish outside month after a multi-moth move higher. IF seen, this would be very similar to what we saw in January 2017 (Trump 1.0) after which it fell for pretty much the next 7-months.
USDCNH
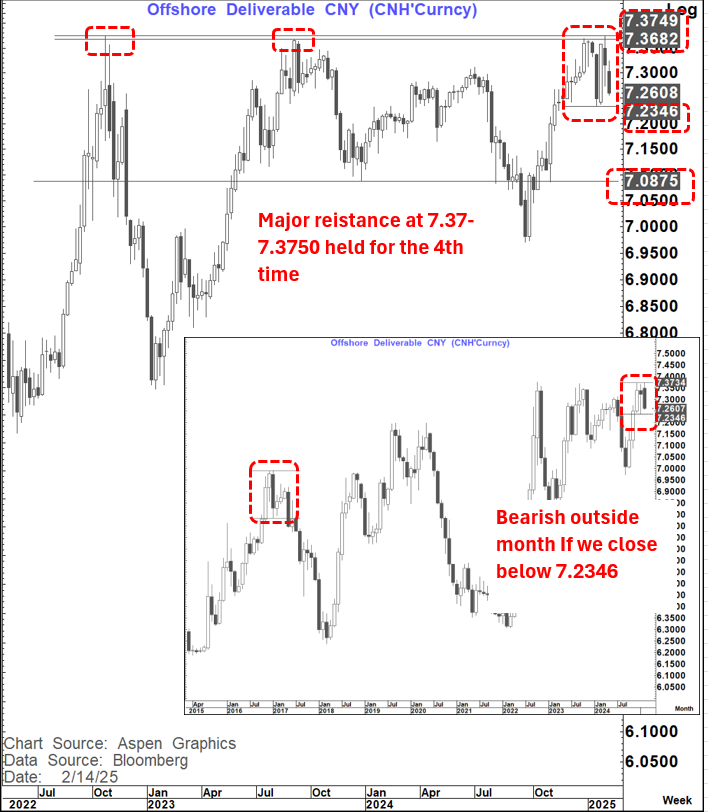
USDCNH also hit a "proverbial" brick wall for the 4th time at 7.37-7.3750 and fell away sharply. It now looks like it is forming a double top with a neckline at 7.2346. A weekly close below, if seen, would suggest a move lower towards 7.09.
In addition, a monthly close below 7.2346, if seen, would be a bearish outside month at the trend high. This is also what happened in January 2017
USDCAD
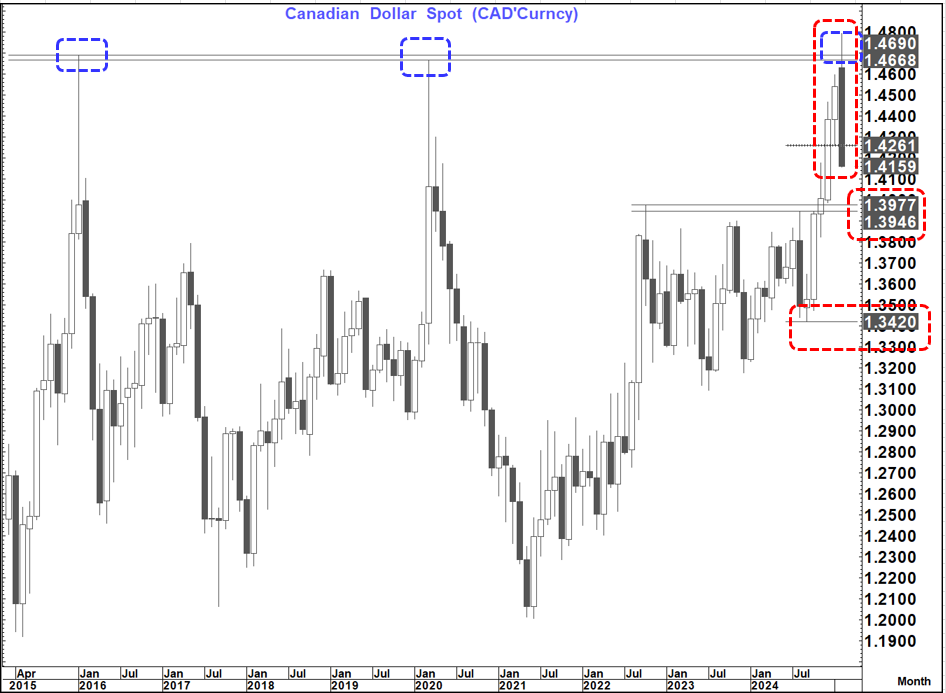
Yet another "brick wall" around similar highs to those seen in both 2016 and 2020.
Now, if we finish the month below 1.4261, we will have a bearish outside month "to boot". The next level of support is around the 1.3946-1.3977 area, but the reality is, with the added bearish outside month we should be looking at the possibility of an extended move towards support at 1.3420
The 3 charts above combined suggest a danger that we are on the cusp of a material downtrend for the USD in general over the months ahead.
Commodities
Copper
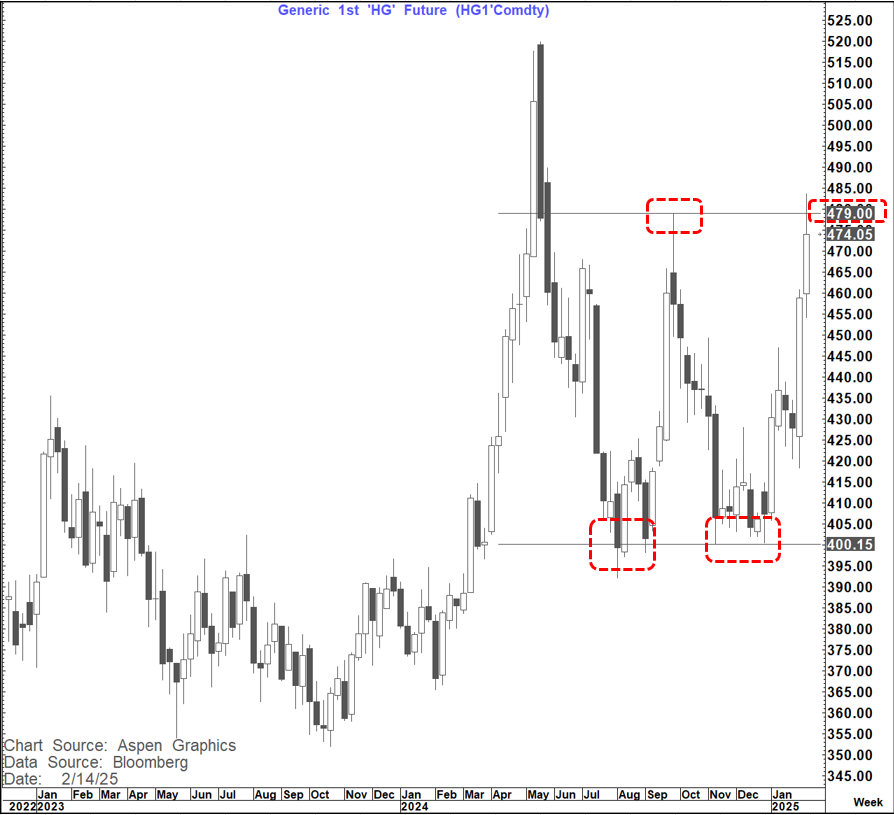
Copper has tested the pivotal resistance area around $480 but has fallen away after today's data. This level is very pivotal and needs to be watched from both perspectives.
On one side this could be a major failure like we saw when WTI failed to sustain for a weekly close above $78.50-$79.00 and fall away sharply to levels close to $70.
On the other hand, if it does rally again and close on a weekly basis above $480 that would be very bullish and suggest as high as $560. However, for now, if we do not regain this level at the close today this should be looked at as a possible big, failed break just like we saw on Oil.
WTI
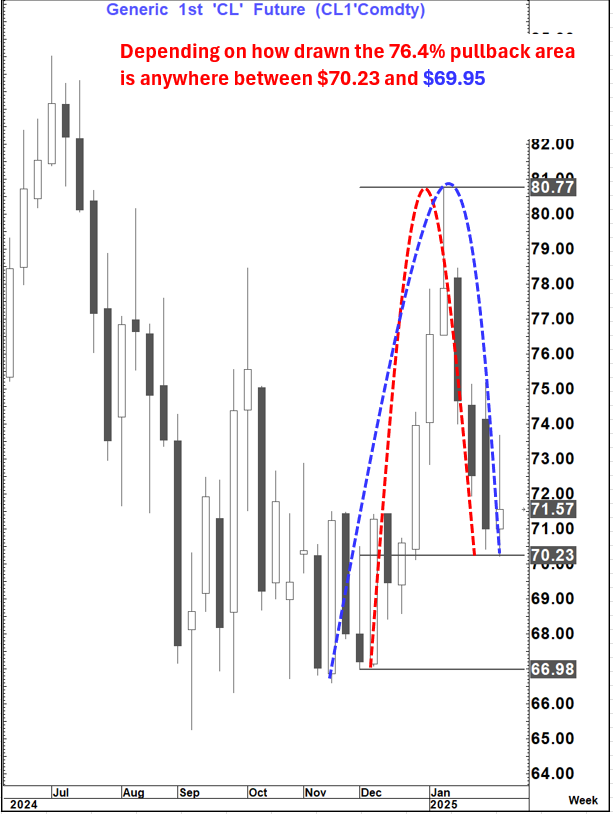
WTI retains an overall bearish bias but there is a big pivot to watched at $69.95-$70.23 that suggests short-term caution (76.4% pullback) after a recent low of $70.22
We need a decisive break of this range (weeekly close) to open up for a move towards $66 to $67
European Natural gas (TZT1)
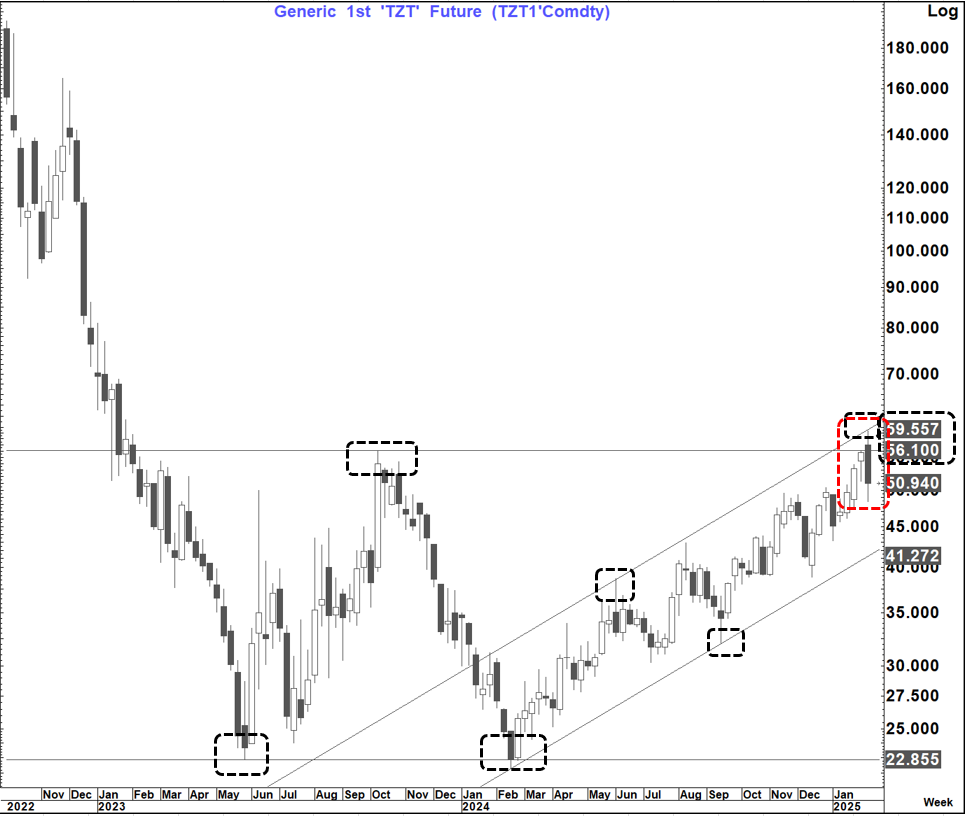
Right now, TZT1 looks like a clear failure at the peak. It failed to sustain a break this week above the double bottom neckline at EUR56.10 and turned off the top of the 1-year+ up channel.
Now it is set up to post a bearish outside week at the high of the move today on a close below EUR 51.29. That close, IF seen would be the first bearish outside week since December 2021 which resulted in a subsequent 65% fall in price
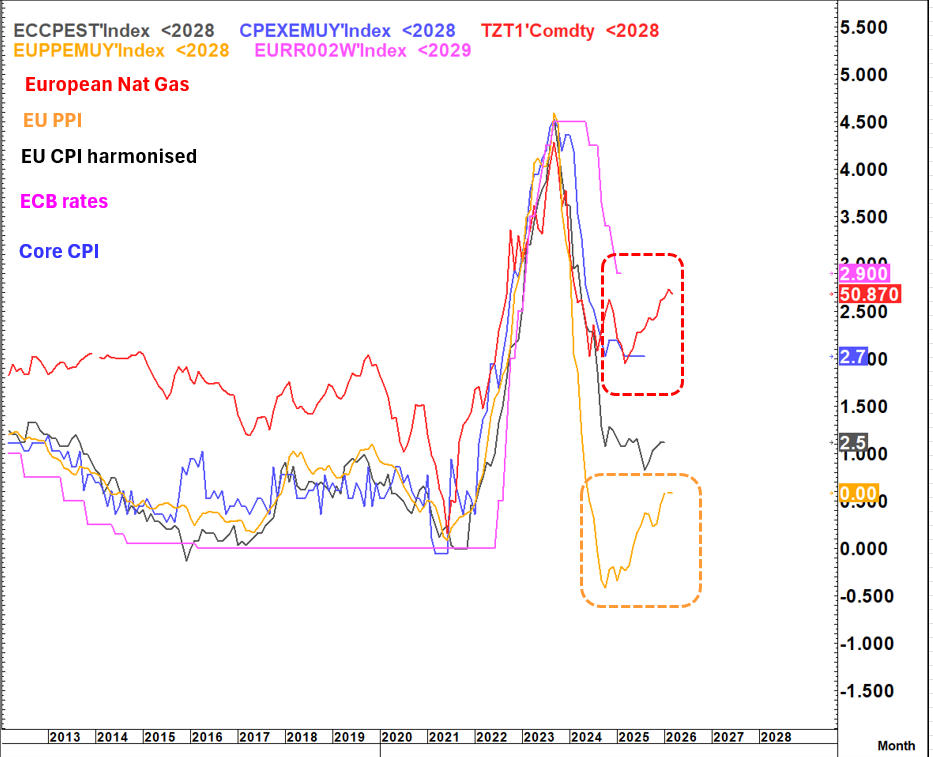
Why is this important? I have previously pointed out the chart below of European natural Gas, European inflation and ECB rates and they are inextricably interwound. A falling Natural gas price is a positive leader for inflation starting with PPI and finishing with Core CPI and its feedback into the ECB single mandate (inflation) and ultimately a very sluggish economy.
Those inflation numbers are inevitably rising again as a lagged move to the renewed gains we have been seeing from Natural Gas. However, a strong fall away here would give the ECB the ammunition to ignore those "base effects" and stay on path with their policy cuts (although likely not without a little angst/caution first)
Gold
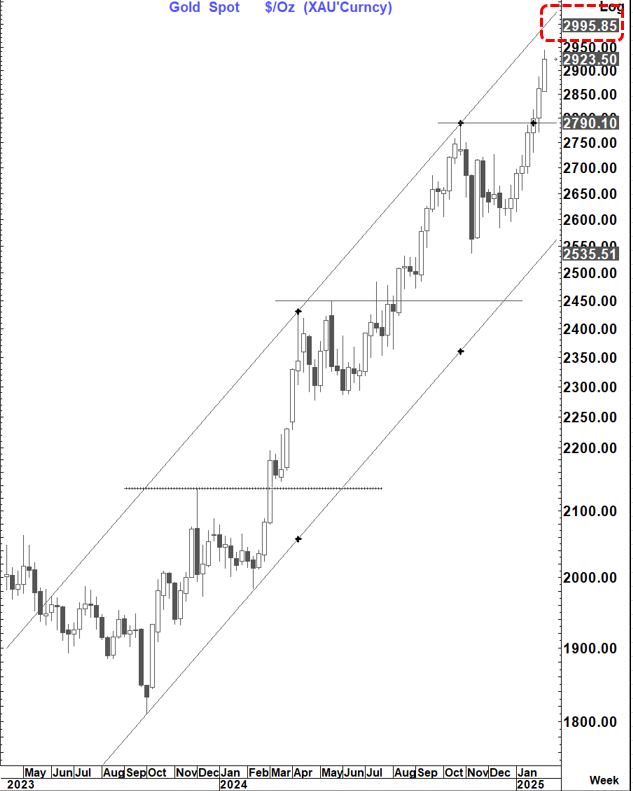
While I have taken a more cautious stance on Gold short-term with the recent choppiness the uptrend is still intact and the $2,990-$3,000 target still looks achievable in the near-term
Yields
US 10-year yield
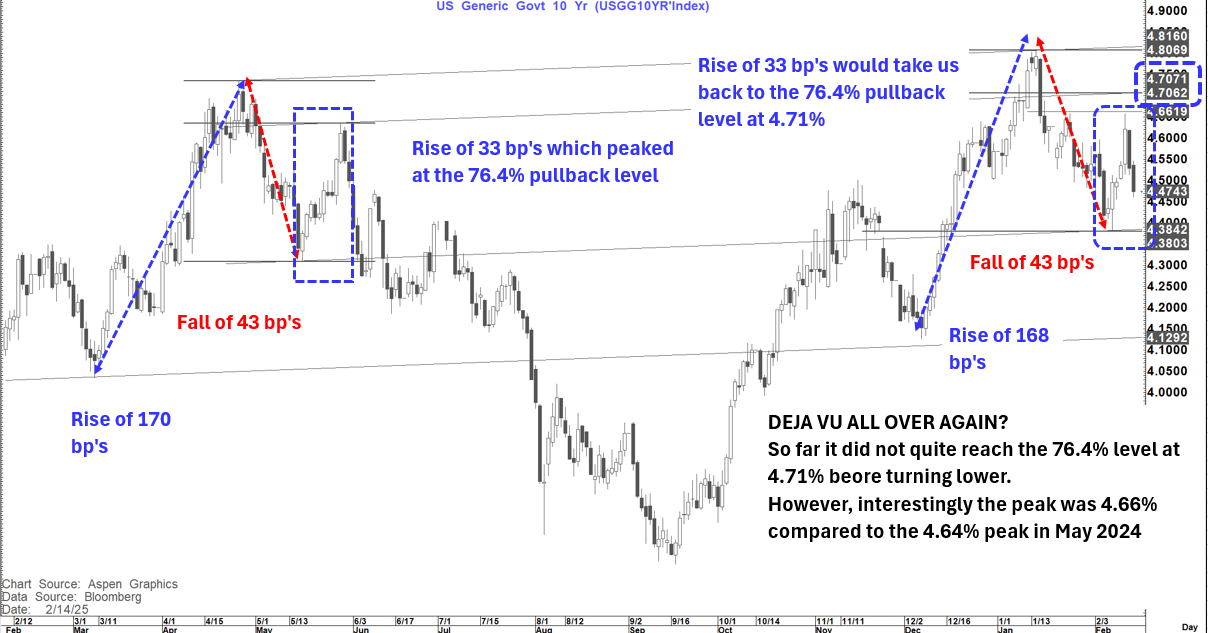
The move higher this time compared to the last bounce to the 76.4% pullback level in May 2024 fell slightly short of the 4.71% level (76.4% pullback) but was a very similar peak to that seen in May 2024 at 4.66% compared to 4.64% then.
Is this a major turn lower starting? Still a work in progress but we are below 4.49-4.51% again putting the recent 4.38% low into focus.
Below there and it would be hard not to think it is and below 4.38% puts 4.20% or lower back into play.
My bias at this point remains for lower yields and potentially flatter curves and of course a weaker USD (Unless yields are being driven by risk off which is not the case right now)
Equity Markets
Both the HSCEI and the Eurostoxx 50 are testing pivotal levels (the latter being a much more major 25 year high finally being re-tested.
