
Late on Friday I put out a note titled "Hello From The Other side which in case you missed I will repeat below.
When the World is ending it is always a good time to look at the other side.
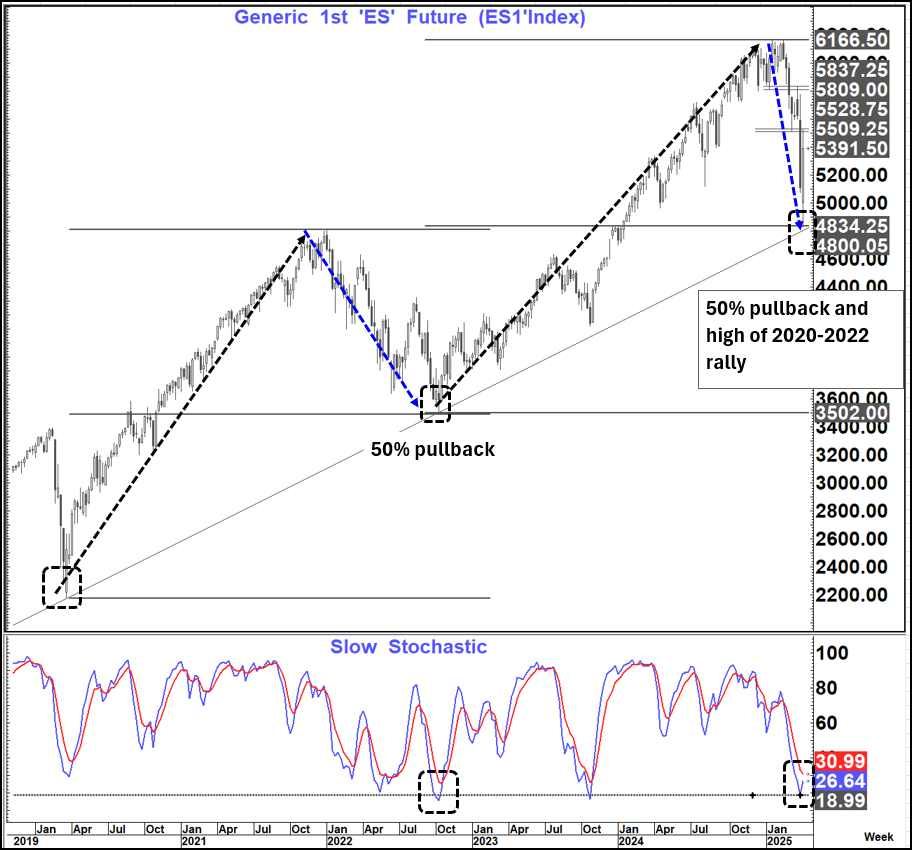
In that respect the Es1 chart below is interesting
After the 2020 low the equity market surged higher into a peak of 4,808 in Jan 2022 before correcting 50% of that move for a long-drawn-out nominal fall of 27% into October.
Then a new surge began in 2022 into early 2025 where we peaked at 6,166 before correcting 50% of that move for a sharp nominal fall of 22%
That retracement not only held the 50% pullback but also the prior January 2022 peak before bouncing.
Weekly momentum is trying to turn up from similar levels to those seen in October 2022 and as I write this we are in line for the biggest up week since the bounce off the corrective low in October 2023. (5.75% back then) Es1 closed the week up 5.5% on Friday
That prior move ultimately regained the old highs and more and while I am not saying that the same will happen this time, I think we need to be aware of the dangers of a further squeeze.
Very good resistance still stands at 5,509-5,529 and should be difficult to overcome. IF we were to sustain a weekly close above that level then the danger would be of extended gains possibly as high as 5,809-5,850
This is all a work in progress, and we are clearly in a much more dangerous world and distorted market environment than 2022-2023
Without a clear resolution to these tariff issues, we have a real danger of a 1929-1930 ongoing dynamic reducing confidence and economic activity and it is hard to see how all the damage (real and good will) will just dissipate.
So, at the moment I am inclined to look at this as more of a bear market bounce than a turn.
However, even if we see the levels above within a bear market bounce it could still be a material move up from here.
A failure to clear that 5,509-5,528 area and/or a rollover that starts to take us back towards 5,000 would obviously be concerning developments....but right now there seems real danger that the move last week could illicit an even bigger bounce.
This market clearly has 2 way and weekend risk now and at the moment I am more cautious (at least for now) on the downside and that this squeeze is in danger of going higher still.
Since I wrote this note we had a further announcement of "exemptions" that should be positive for companies like Nvidia and Apple and I expect barring a new negative that will open the market on a buoyant note on Sunday night.
So, to use Trump's own analogy, at this point with regard to the "sick patient" I look at this as a remission rather than a recovery.
After the 10.5% fall into 12 March (similar to that seen in July-August) I expressed a view that the market was susceptible to a good bounce but unlike that seen after the August low we did not have the backdrop for that bounce to regain the losses seen.
We subsequently regained 50% of the losses (We seem to have a lot of 50% moves these days) bouncing nearly 6% before the turn lower again.
Despite China's retaliation the response we saw was an announcement of exemptions not a move raising the temperature further and that with the 90-day pause for everybody excluding China lowers the temperature but is far from signaling a turn.
Despite China's retaliation the response we saw was an announcement of exemptions not a move raising the temperature further and that with the 90-day pause for everybody excluding China lowers the temperature but is far from signaling a turn.
The 90-day day pause is a "double edged sword"
To use an analogy-remember with the talk of a ceasefire in Ukraine one of the arguments against was it allowed parties to re-arm and thereby extend the conflict.
Here the danger is that the major countries use this time not just to "negotiate" with the US but also with each other to form protective trade agreements. The 90-days will also be used to determine ways to mitigate any re-imposition of tariffs as well as to retaliate if that takes place.
The reality is that total US trade in 2024 (imports and exports) was about USD 5.3 trillion and The EU, Canada, Mexico, China and Japan made up about USD 3.4 trillion or 64% of that total as well as 65% of US imports.
These are the countries that count and touting deals with Australia, the UK (Both of whom we run surpluses with) and India was just trying to push positive headlines.
These are the countries that count and touting deals with Australia, the UK (Both of whom we run surpluses with) and India was just trying to push positive headlines.
It does not move the needle. If and only if we start to see agreements with the "big fish", then maybe the backdrop changes. However, I suspect that China and the EU in particular will be very disinclined to "bend the knee" here and more inclined to focus on other alliances.
If this happens this can all "kick off again". This is the most important point- there will likely be no certainty to this process anytime soon which will temper growth, capital investment and employment decisions- which I still argue (using the Smoot Hawley comparison) is more deflationary that inflationary.
On top of that monetary policy has tightened aggressively (long end of the curve) and financial conditions have also deteriorated sharply. In addition, as we know both swap spreads and basis trades have been "blowing out" in recent days as we start to get headlines of financial casualties taking place.
All this while the Fed sits on its hands and preaches how inflation is still it's main focus. When they eventually crack (and they will) they will be so far behind the curve and will once again have to engage in "shock and awe)
But I do believe this is for another day in the not-too-distant future. To use an analogy again ... The car speeding uphill with no brakes has run out of fuel. The original momentum from this allows it to continue to move forward even though the fuel has run out. Then that momentum comes to a halt. then the car starts to head down the hill even faster than it went up with no brakes to stop the downward momentum (until Brembo (or the Fed in financial markets) comes to the rescue). Right now, I think we are out of gas, heading close to the stop and thereafter towards the speedy fall.
But I do believe this is for another day in the not-too-distant future. To use an analogy again ... The car speeding uphill with no brakes has run out of fuel. The original momentum from this allows it to continue to move forward even though the fuel has run out. Then that momentum comes to a halt. then the car starts to head down the hill even faster than it went up with no brakes to stop the downward momentum (until Brembo (or the Fed in financial markets) comes to the rescue). Right now, I think we are out of gas, heading close to the stop and thereafter towards the speedy fall.
In the near term as per my note above the market is desperate for some solace and is going to grab hold of these snippets of flexibility to try and be bullish again.
For those who remember the GFC in 2007-2009 the fall in Es1 which eventually became a high to low move of 58% first saw the market start to fall in October 2007 with a number of counter trend bounces into August 2008 before the move accelerated lower, I think there is a more than decent chance that this bounce could test that 5,509-5,528-range next week and then we need to see what happens. Does it top out there or maybe even extend towards the 5,809-5,850 area?
For those who remember the GFC in 2007-2009 the fall in Es1 which eventually became a high to low move of 58% first saw the market start to fall in October 2007 with a number of counter trend bounces into August 2008 before the move accelerated lower, I think there is a more than decent chance that this bounce could test that 5,509-5,528-range next week and then we need to see what happens. Does it top out there or maybe even extend towards the 5,809-5,850 area?
My bias is the former but that will be a work in progress.
Most importantly, at this point, I feel (just as I did after the March bounce compared to August last year) that we are not setting up for the full-blown recovery that we saw after the lows in 2022 but rather a correction/ remission before the prognosis deteriorates again.
My base case right now would be for a recovery towards 5,500 followed by renewed losses towards/ below 4700.
What will this mean in other markets?
What will this mean in other markets?
The US 10-year yield traded to and rejected the 76.4% pullback level at 4.58% suggesting at least a short-term top could be in and we could retrace back towards 4.20% again.
IF 4.58% were to give way then the picture would strongly deteriorate again and open up for a move towards 4.80-4.83%. My short-term bias here is more the former than the latter.

Gold has been a great performer but shows signs of a possible short-term top and correction and a move back towards the old highs at $3,168 would not be a surprise. However, I suspect we will still see much higher Gold levels going forward with an initial $3,300 topside target

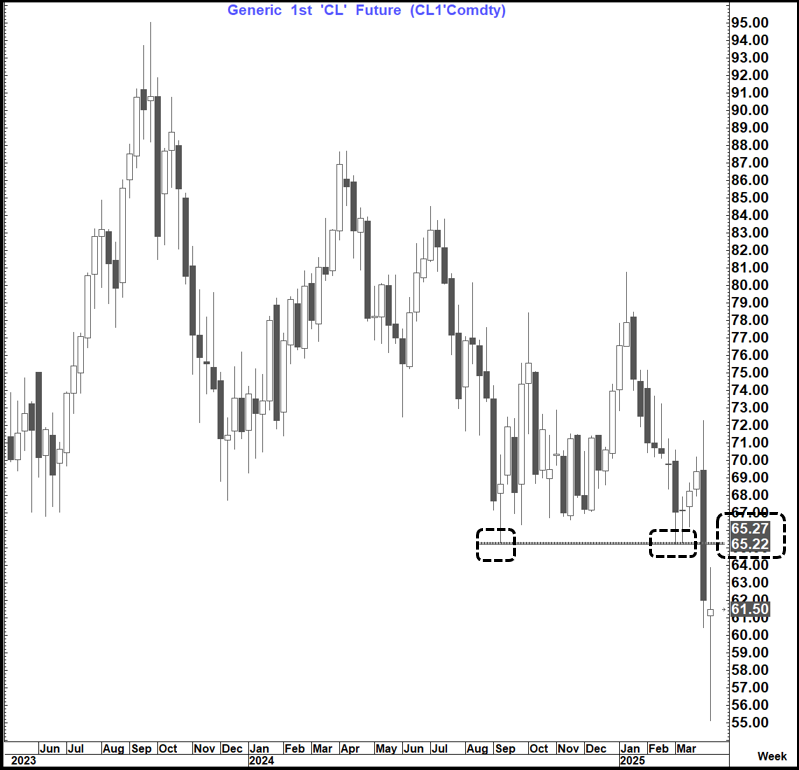
WTI is still in danger of completing a bearish outside month (Close under $65.22) which would suggest much lower levels. But in the near term I would not be surprised to see it drag itself back to or slightly above $65 again.
The BBDXY Index (Bloomberg USD Index) is close to material support at 1224-1228 (rising trend lines, 55- month moving average and 76.4% pullback level of 2023-2025 rally) suggesting a possibility of a near term pause. However, a break below that range would open up for a test of pivotal support at 1198 (low off which a major 76.4% retracement took place). Below there and a move back towards 1,110 to 1,135 would look a danger
Bottom line:
I think the equity market can bounce further as we start the week but look at this bounce as a corrective rally that will likely give way to renewed losses before long.
Bottom line:
I think the equity market can bounce further as we start the week but look at this bounce as a corrective rally that will likely give way to renewed losses before long.
I think we can also see a respite on US yields and possibly a top , IF, we do not break above 4.58% on the US 10-year yield. This move does not look like a technically or fundamentally supported move \but more of a position squeeze (In a way Gold was the same until recently). I therefore think that we can see Fixed income (possibly even with some official support) stabilise and trade more bid as is normal during financial/economic stress.
Above 4.58% would concern me in this respect as it would suggest a move towards 4.80-4.83%. A break of that latter range, if seen could only be described as "the wheels coming off" and would be of great concern.
I think we can also see some short-term USD respite here and maybe even see EURUSD back towards 1.12 and USDJPY towards 146. However, I am not convinced at this point that the USD resilience will be sustained in anything more than the near term and the danger remains of renewed USD losses as per the Bloomberg USD-index chart above.