***First things first.
I will be out of the office until Wednesday March 19th and will be checking my email intermittently***
Before that I want to make a few quick observations following Friday's close.
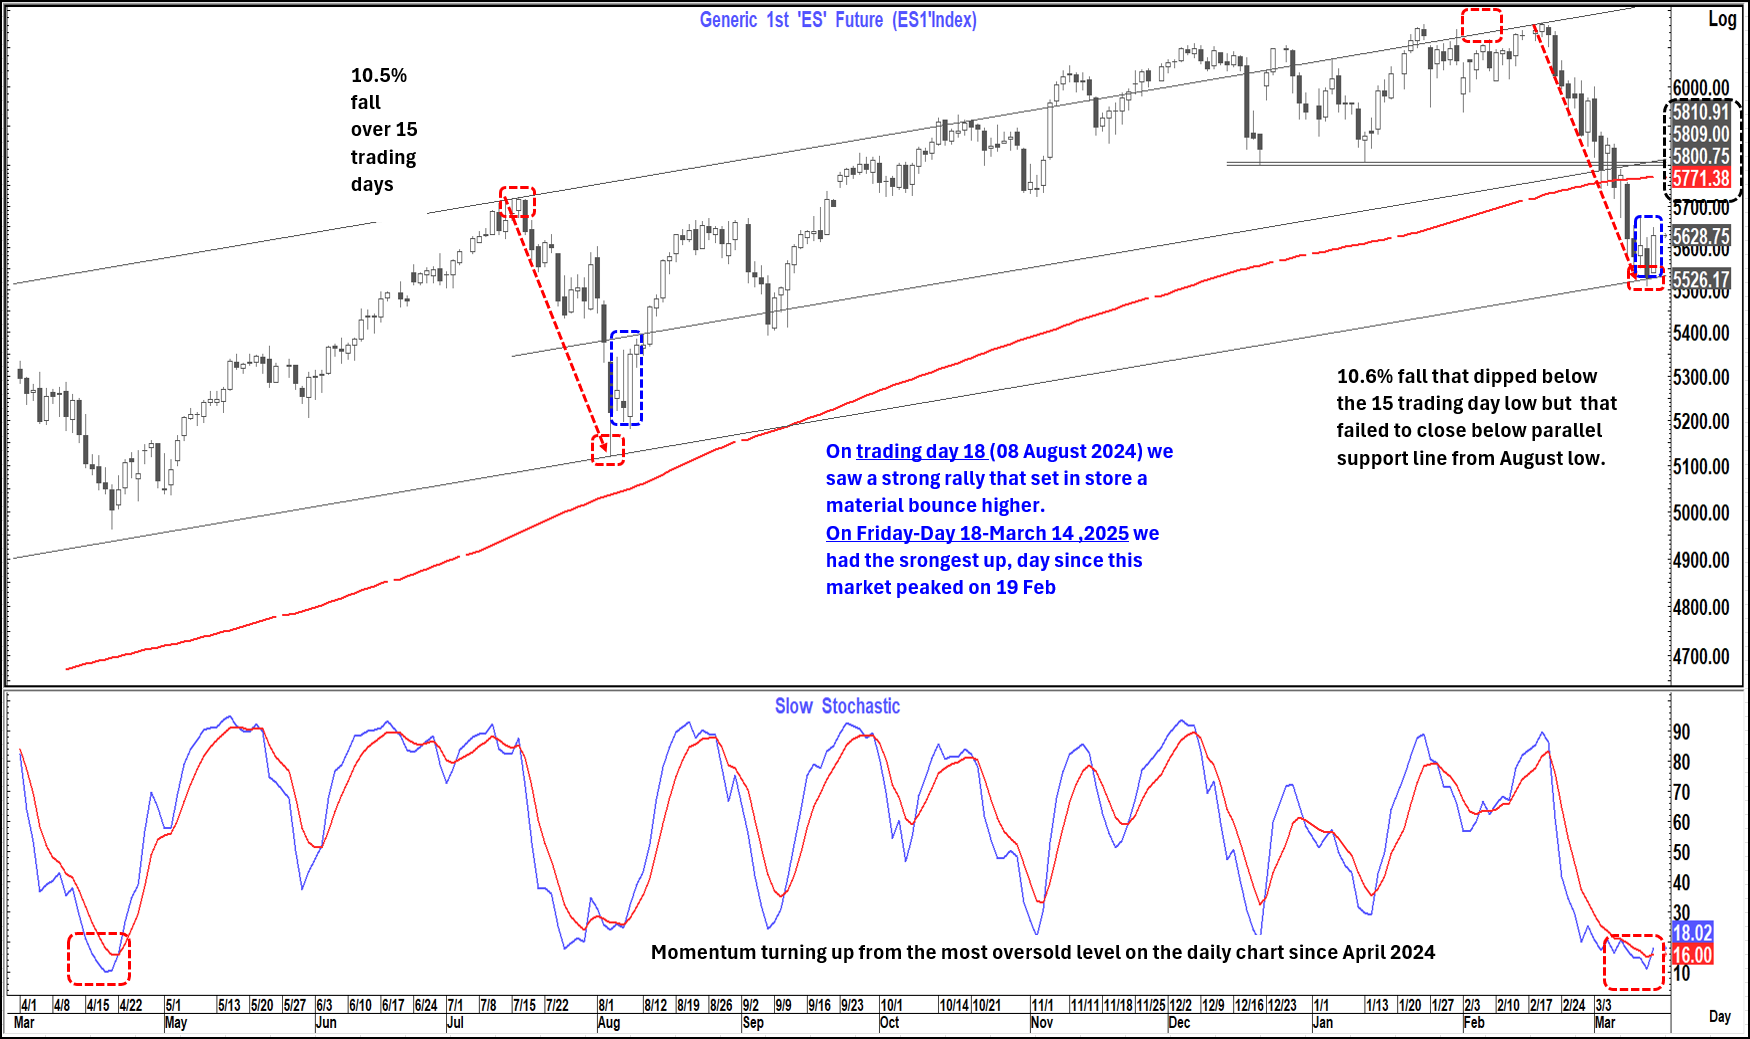
The analog from July-August 2024 and Feb-March 2025 has tracked almost perfectly.
This includes the "Trading day 18" sharp up move that we saw on Friday in a fashion almost identical to the "Trading Day 18" move on 08 August 2024" This following a down move almost identical in time and magnitude to that seen back then and as detailed below.
Now if we were to simply extract that analog we could "Shout From The Rooftops" that the low is in and that the equity market may now proceed back to post new highs in the next few months.
I am not doing that. WHY?
Those who had read my musings over the years know that I regularly follow a "TECHamental approach". That means that in addition to looking at traditional technical indicators (with a focus on a number of indicators I like) I also look at analogs like the one above.
I also focus of some fundamental indicators, cross market indicators, economic history, financial history, psychology, politics, geopolitics etc- a whole building block approach if you will.
There is no doubting that the chart below is very compelling but what is the backdrop like today versus then?
Apart from the technical picture above the first question to ask is what was the likely catalyst for the bottom on 05 August and subsequent turn higher in the market.
To me that is clear (opinion not fact)
On 5th August last year Kamala Harris was confirmed as the democratic presidential nominee and the market virtually instantaneously decided she would not win. From that day onwards the market did not really look back, rallied into and out of the election and continued higher to the peak eventually formed on 19 February for a rally of just over 20% from the 05 August low.
What else was going on in that period? From 08 August 2024 to 17 Sept 2024, we saw the US 2-year yield fall from 4.02% to 3.6% as the market (and the Fed ) were getting increasingly concerned about the employment backdrop.
Unemployment had printed at 4.3% in July (subsequently revised to 4.2%) and 4.2% in August (0.8% off the trend low). NFP had printed 114k in July (revised down to 89k on first revision) and followed that with a 142k print in August making them the lowest back-to-back prints since 2021.
I argued that the body language and comments from Jay Powell suggested that he wanted to cut and likely 50 bp's and that Jay would get what Jay wanted.
As we all know on 18 Sept 2024 the Fed did indeed cut 50 bp's and also gave us another 50 bp's in cuts by year end.
The fall in the Oil price (WTI) by 18.6% from $80.16 on 12 Aug to $65.27 on 10 Sept 0nly served to solidify that move.
And of course, we had Chris Waller "trotting out" the positive inflation narrative about how promising the (selectively chosen) 4-month annualised Core PCE rate (around 1.8%) was looking.
It was classic Fed. They now wanted to cut so they gave a narrative to support that action by selectively choosing supportive factors.
It was a perfect storm, and the Equity market loved it.
The Fed had pre-committed but then started to "wobble again as we got a 0.3 core PCE number in September and again in October (long after the Nov Fed meeting and just before the December one). The Fed went back dangerously close to pausing in December but (possibly against their better judgement) cut again on 18 December and went into "pause mode.
The Equity market did not mind and continued to move higher along with Bitcoin and the most famous EV car company in the World on the back of "Trump 2.0" and the talk of tax cuts, deregulation and the "end of wars". You will remember that in "Trump 1.0" the Equity market also powered higher into 2017 and continued higher throughout that year.
How does the backdrop look today?
- The economy is clearly slowing as evidenced by recent data- even if we do not get the negative growth numbers coming out of the Atlanta fed GDP now calculation. (I suspect that the hugely negative net exports number fuelled by front-loading, tariff beating purchase have distorted that number)
-The employment picture is clearly softening as evidenced by a variety of indicators recently- not least in the employment report where:
We got the first back-to-back NFP numbers on a "1" handle since July (revised even lower on first revision) August.
The participation rate dropped
The employment rate rise 1-10th and the underemployment rate rose by a "whopping" 5-10ths as we lost about 1 million full time jobs and created about 900k part-time jobs. The same day consumer credit once again beat on the topside as we see increasing suggestions that the consumer is "tapped out"
Tariffs have become a big concern now not least because of the uncertainty they bring. Businesses have clearly been "front-loading " purchases in anticipation of tariffs-likely driving up prices on this front-loading surge in demand- hence a number of higher prices paid numbers. The problem with this is that IF the economy is slowing and the employment picture is softening, they have little or no chance of passing on those prices to the already "tapped out "US consumer- which means they may have to be absorbed in profit margins.
The Oil price is a ray of light" having fallen almost identically to that fall in August-Sept period last year. This time from $80.77 in January to $65.22 this month
Geopolitics is in flux with the Ukraine situation still fluid and Iran effectively "thumbing its nose" at President Trump last week. Is the Houthi attack by the US a sign of possible escalation here?
But most importantly in all of this the Fed has shifted to a different narrative to that seen in August last year. They are continuing to "hold the line" despite recent market turmoil and economic/employment weakness in a very "2000 esque" approach. They preach that inflation is still too elevated. Jay harps on inflation expectations and flawed though it clearly is, the recent Michigan numbers will give him no solace.
They fear the effects of tariffs notwithstanding that remains a "known unknown" In addition any tariffs that feed through to inflation are a tax and a de facto fiscal tightening. Unless you believe this can feed to 2nd round effects- which is not happening if the economy is in fact slowing employment softening and the consumer tapped out -you should in fact look through it.
They are not doing so, and I expect Jay will double down on that this week (Although possibly leading to another embarrassing about turn in May or June at the latest.
So, what does this mean for markets- Let' start with equities
The technical picture on Es1 is very like August last year and somewhat like April so after Friday a continuation of this bounce next week would make sense. I would not be surprised if this could even take it back to very good resistance around 5,770-5,800 in the week ahead consistent with what we saw In August last year and also to a certain extent in April.
However, the longer-term picture on the equity markets still looks concerning and suggests further downside is still a danger medium term.
The US 2-year yield has started to move higher from the recent lows at 3.83% and If it breaks over 4.04% it looks like it could head higher still- with a possible target as high as 4.25% with good resistance along the way at 4.075% (breakdown area that targeted a move towards 3.77% compared to the low so far of 3.83%) and then 4.17-4.19%
This I believe can be a function of continued Fed stubbornness and may in the near-term result in some bear-flattening on the 2's 5's curve (my financial bible) and the 2's 10's curve. Even If that happens, I suspect it then gives way to bull flattening (as the equity market loses steam) and ultimately bull steepening (although not inconceivably after 2's 5's going negative again and possibly even heading as low as minus 20) as it starts to become obvious that the Fed will once again shift.
Initially the USD should be well supported against the JPY and CHF in particular and also a little against the EURO. I had been looking at the November 2022 analog and the possibility of a move lower to 1.07 before turning higher again early next week. This may well still happen but if we get the constitutional vote through in Germany that may provide an earlier lift to EURUSD as we likely see European stocks benefit and German yields firm up gain.
I think this "uncertain" backdrop remains supportive on Gold. We finally got to our $3,000 target last week but the turn lower in the Gold/Silver ratio off big levels suggests to me that Gold could still continue higher from here.
So bottom line we still have a scenario this week that could see US equities higher, yields higher (possibly lead by the 2-year yield- so curves flatter) and the USD selectively higher.
However, I remain sceptical that this is anything more than a short-term position driven squeeze and suspect that as early as the end of next week the core trends of lower equities, lower yields and a lower USD may start to reassert themselves.