We have had our first week of trading in 2025 (sort of) which felt (at best) messy and disjointed.
It feels like this is the week that things really get started.
Markets have chopped in both directions. Long end yields in the US are in a short term-range with the market trying to decide what to do at this big pivot on the 30-year yield at 4.845%.
It feels like what we do here this week may well define what the next trending move is.
A hold would suggest that the danger of a move lower in the near-term in a "risk off" environment (as suggested by a cross section of daily charts) is still the immediate danger.
The medium-term bearish case remains compelling, however, as noted in the 12 charts of Christmas piece in December.
Right now, in that respect, we have Strike 1 and Strike 2 with the question being is "Strike 3- You're out" imminent?
Strike 1
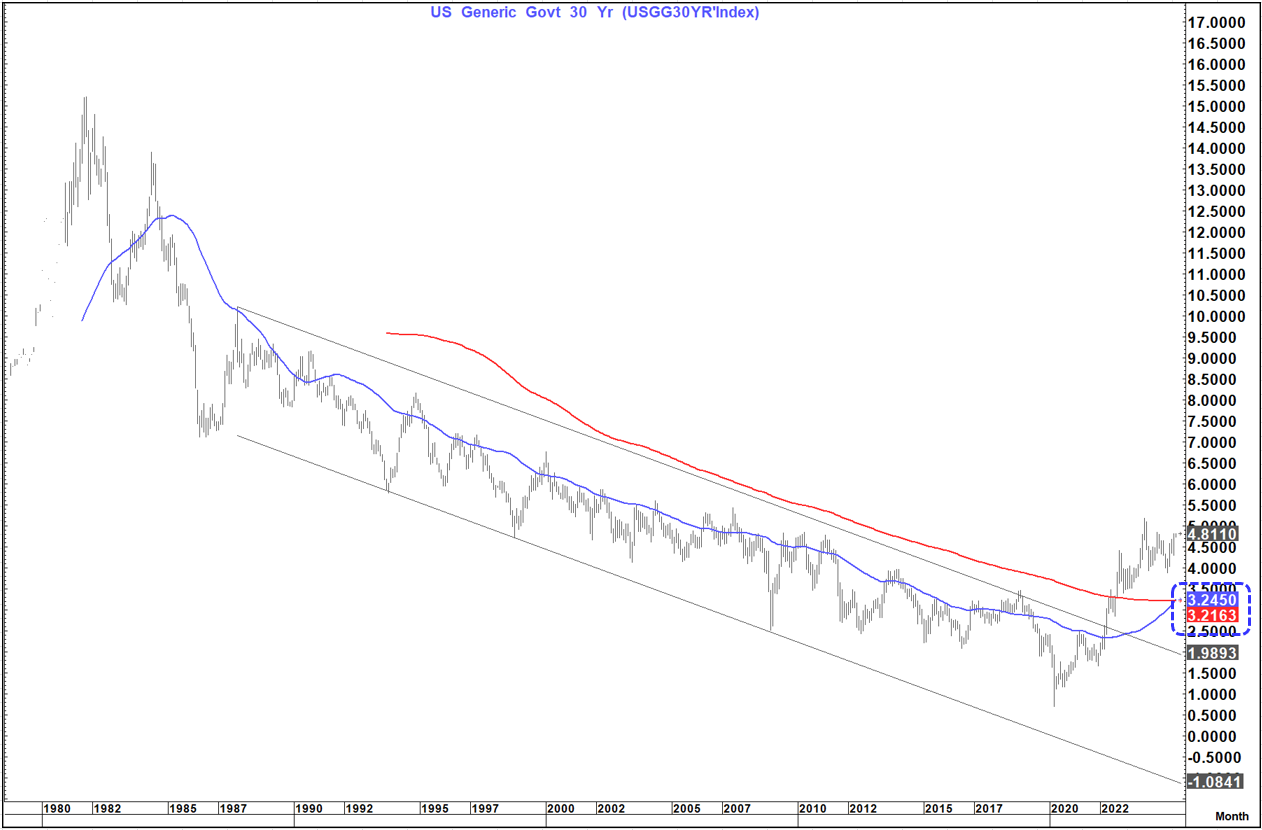
We have seen the 55-month moving average close above the 200-month moving average with both sloping upwards for the first time since the multi-decade bull market began in 1981. It is true that often the point at which this happens is often not the best timing to "join the trend" but the development is material, nonetheless. This would signal a prospect of much higher yields to come.
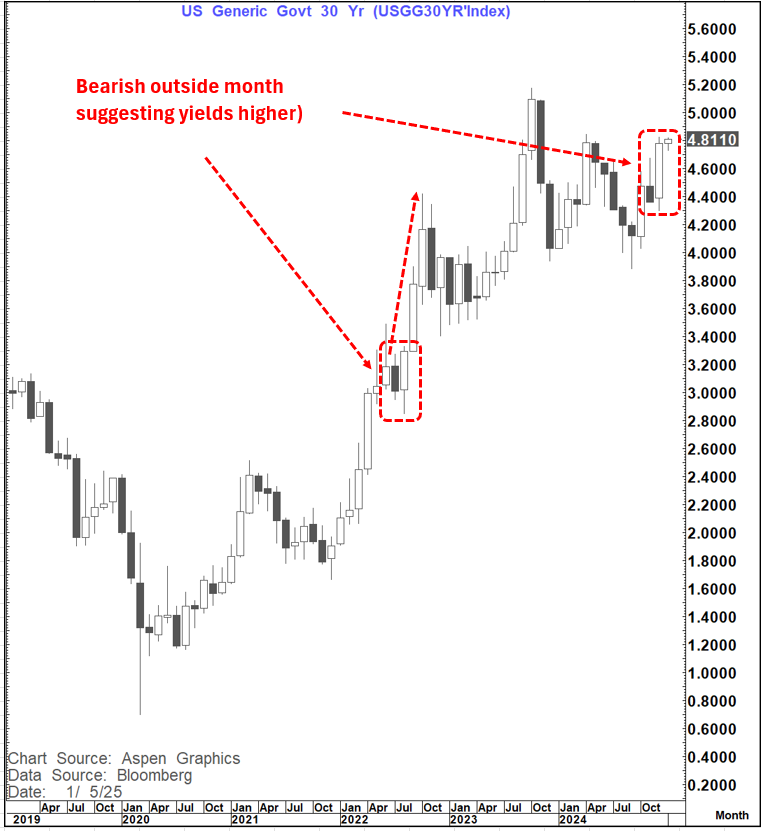
Last month we saw an outside month in the 30-year yield (lower low, higher high and close above the prior months high) by closing over 4.68%.
The last time that happened was August 20222 as was followed by 2 consecutive months where yields headed sharply higher for a total move (post the outside month) of 113 basis points. A similar move this time, IF seen, would suggest a move that could takes us up towards 6%.
We also had the outside month on the future (US1) just as we did in August of 2022.
All of this comes after we also made a decisive break of the pivotal area of support on TY1 around 109 that also suggests much lower price and higher yield.
Strike 3
In recent days I have posted notes suggesting short-term caution here as the "final line in the sand " has continued to hold at 4.845%.
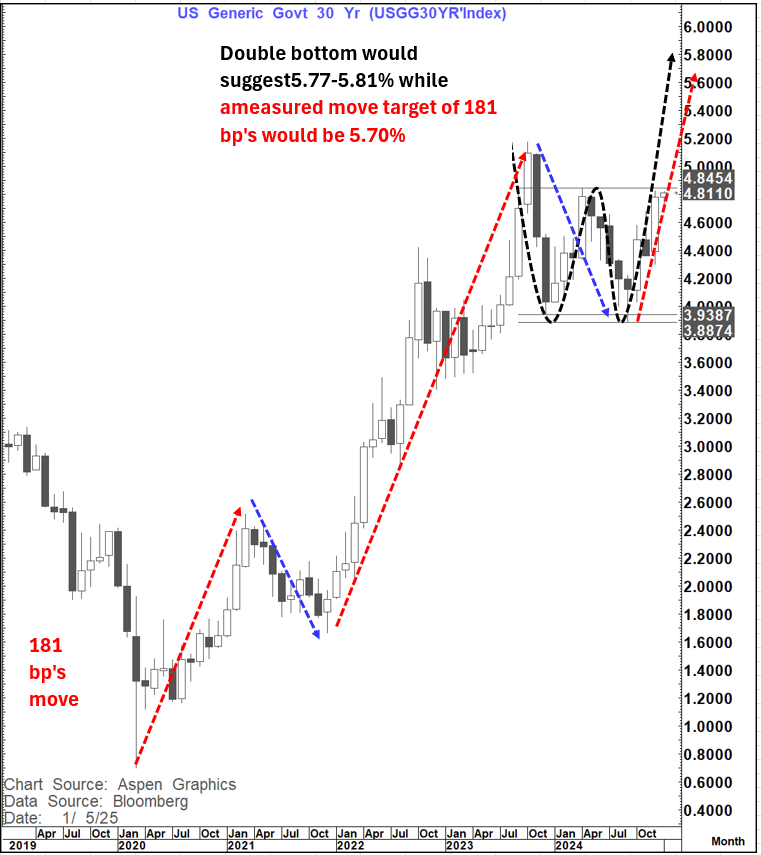
This is both the high posted in April 2024 and also the potential neckline of a clear double bottom formation. It also comes after a move higher in yield very similar to that seen into the April 2024 high and somewhat similar to the mover higher into November last year. The Equivalent level to watch on US1 is 112-27.
A decisive break 4.845% (at least weekly close) would suggest not just a return towards the trend high at 5.18%but an extended move towards 5.77-5.81% while a measured move target would suggest in the region of 5.7%
While these levels continue to hold, we do not have the 3rd and final strike that would unequivocally signal a further move higher in yields and therefore, for now, retain the danger of a short-term correction lower.
For that to materialise I feel we either need a significant risk off picture to continue to develop in Equities (In that respect I am watching 5,866 to 5,875 in ESA futures (S&P) and 21,006 in NQA futures (NASDAQ) or a weaker fundamental outlook-(particularly in employment), or both.
From an economic perspective we have important data this week in JOLTS, ISM services and most importantly Employment data.
All of this suggests to me that this week is key in whether we see "Stike 3- you're out" (Bond market) or the dangers of a pause in this move higher in yields suggested by the daily charts materialises.
A break is obviously a much bigger development as it would suggest a continuation of the trend, whereas a hold would suggest a pause or correction but at this point would not be enough to suggest a more material turn
Which of these developments has materialised as the week closes will, I think, shape market direction in the weeks and possibly months ahead.