So, the year is almost over and what a year it has been.
I would like once again to thank everybody for their support over the past year and wish everybody a very Happy Holiday and all the very best for 2025.
It certainly looks like it could be an interesting year, and I already penned my thoughts in that respect in
In that respect the remaining days of the year could be very random, but I thought I would still pen just a few thoughts also in that respect.
Jay Powell delivered a virtuoso December 2018'esque hawkish performance last week.
Yes, it was different in that he eased rates rather than raised as in 2018, but he effectively did what was expected last week in that respect. He had little choice as the Fed had effectively backed themselves into a corner after the 50 bp's move in September and the 25 bp's move in November.
They clearly wanted to pause after 75 bp's of moves -as they have done in 5 of the last 7 easing cycles as covered in the piece "75 And Pause- We have precedent".
In fact, after 3 of those 5 pauses the next time they moved was a hike.
75 And Pause- We Have Precedent
But they just could not pause.
No matter how much they protested otherwise they know it would have looked political and that is not how they wanted to head into 2025. There just was enough in the existing employment and inflation data to support the move.
So, what they did do was "create" the environment for what they really wanted to do. That is how the fed works, That was transitory inflation. That was the worry about a repeat of the 1970's policy. That was the shift back towards the employment mandate over the inflation mandate and that is now the shift back to the inflation mandate over the employment mandate again. All of this almost makes my head hurt.
The problem of course was they could not directly use the potential fiscal and regulatory changes coming as a reason (too political again and not yet enacted) to pause.
The same went for tariffs.
So, they simply took their 2025 forecast for 2.1% Core PCE and changed it to 2.5% and "Hey Presto" that immediately validated their adjustment of the (non-forecast) dots up by 50 bp's in 2025 and 2026. That together with one FOMC member voting for no change and it appears a number being "absent" in the dot plot (I think we call it "not present" when it is a house vote) and mission accomplished. In one fell swoop they totally offset the move that they did not want to make in the first place.
Happy days. Now the Fed and the market are in exactly the same place in anticipating 50 bp's of cuts next year. This guidance is very important for the focus on next year because you know with almost 100% certainty that with this coming together that is the one outcome that clearly will not take place.
That leave 3 likely outcomes.
No move at all in 2025
More cuts than signaled (50 bps)
The next move will be a hike.
At this stage all those outcomes are in play, and it will likely take a bit of time to determine which is more likely.
My suspicion is that what they have just done is going to result in more tightening. Not from the Fed itself but from the bond market as it adjusts to all the above and the potential increased supply it will bring.
At the end of the day, it is the longer end of the curve that most effects consumers and businesses and if long end yields move higher from here as much as some of the charts suggest then I think there is a real danger that "something breaks"
Since 2020 we have seen the economy grow in size from $21 trillion to $29 trillion (+$8 trillion)
At the same time the National debt has grown from $27 trillion to $36 trillion (+$9 trillion)
So, we have needed $9 trillion of incremental debt to grow the economy by $8 trillion- hardly the economic miracle some would have us believe has taken place
That is before we also factor in that short-term funding costs have gone from 0-25 bp's to as high as 5.25-5.5% and now potentially on pause at 4.25-4.50% resulting in our interest payments (annual) passing $1 trillion p.a. and also accounting for about 13% of the budget in the year ahead (the same as health and just below defense at 14%).
This also means that the Fed will continue to realise significant losses on reducing the balance sheet where they are earning in the region of possibly sub 2% while paying 4.4% on excess reserves. That also means no transfers to the Treasury as far as the eye can see- another fiscal drag.
The employment picture does not look as robust as they would like us to think especially as more "downside revisions" to historic NFP data look to be in the pipeline. The "miracle growth" of Government jobs in September now looks to be a mirage as we are back at 4.2% unemployment again and were a hairs breadth from rounding up to 4.3% last month- the cycle high posted in July that spooked the Fed.
The savings rate was revised higher but is still low by historic standards.
The 30-year fixed rate mortgage is back at around 7.25% having dropped towards 6.5% in September and way above the 2.8% to 4.8% range seen in the decade between 2011 and 2021.
So, what counts here is not whether short-term rates stay on pause but what long-term rates do .
So how does that picture look? well 2 charts are worth looking at. The 10-year future (TY1) and the 30-year yield chart. They clearly show reasons to be concerned .
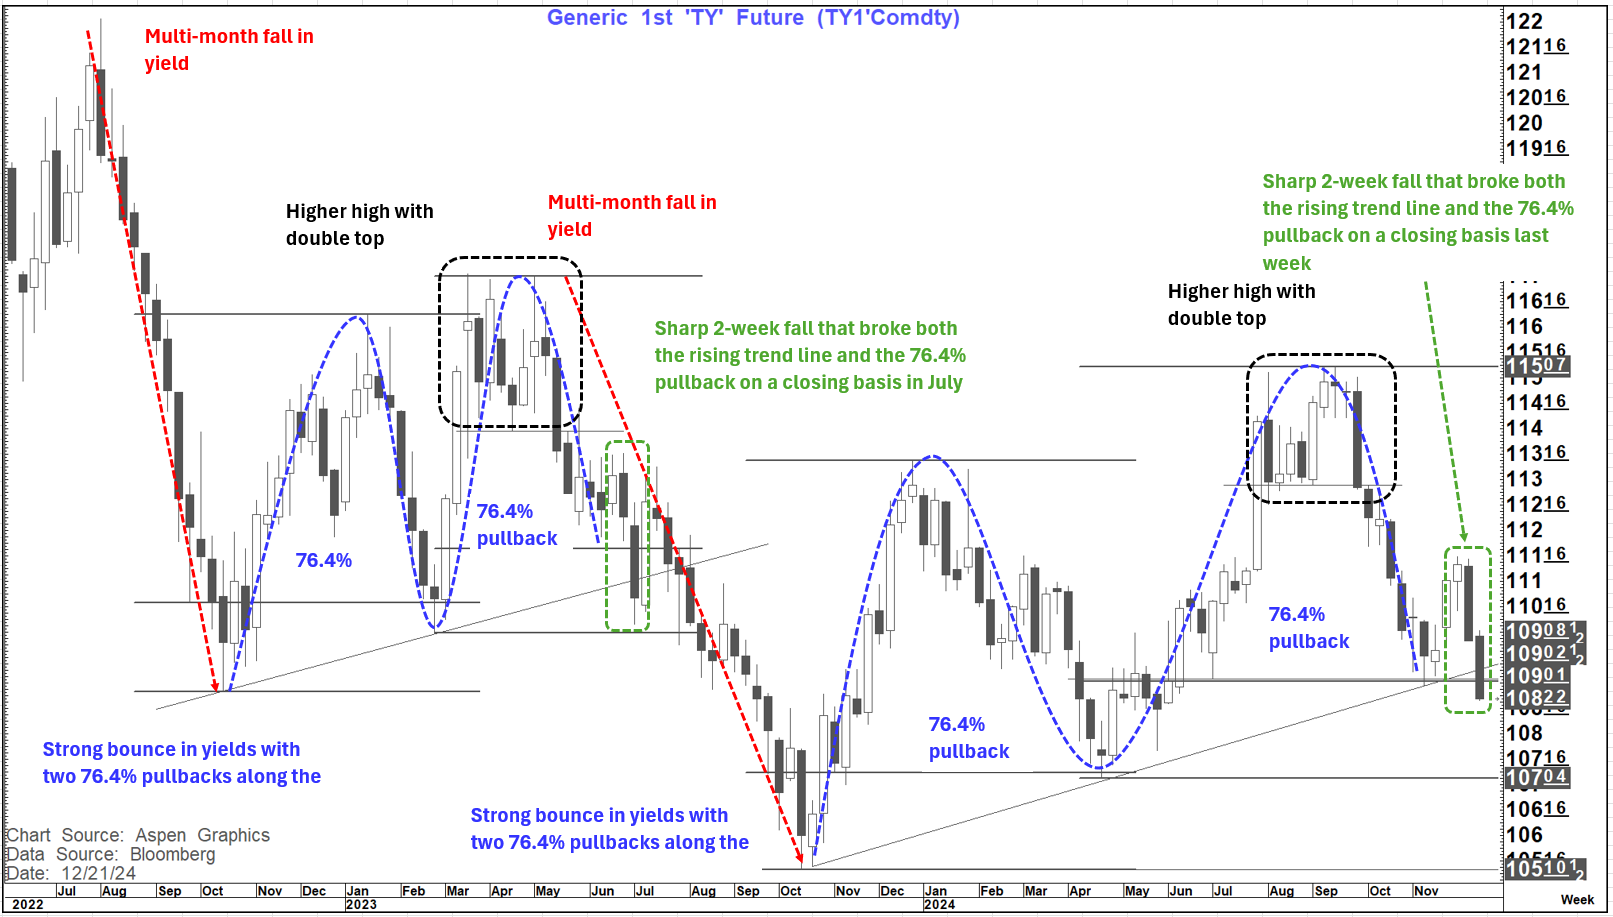
I have banged on in infinitum about the TY1 chart and the importance of the 109 area on a weekly close basis .
That happened last week. What does that mean? the suggestion is that (over time) it looks likely to fall further and send yields higher. In fact , it has been following a path that is very similar to that seen into July 2023 as you can see below. The path has been almost identical albeit the "pace" a bit slower.
As can be seen from the chart we are at almost exactly the same juncture a seen in the first week of July 2023, when important supports were broken on a weekly close basis.
Back then we got a sharp "head fake" rally that saw TY1 bounce by about 3 points over about 2 weeks before resuming the downtrend. A move of that magnitude seems a "big ask" but the market clearly calmed down somewhat on Friday after the soft inflation data on PCE and in the final Michigan numbers.
We saw about a 3/4-point bounce low to high over about less than 24 hours between lunchtime Thursday and lunchtime Friday as well as a material recovery in the equity market. It is now Christmas week with little data of consequence to come. The year is nearly over, and it would not be surprising if we saw more of a consolidation/correction in the near term that might see positions pared back.
A similar bounce to July 2023 could even suggest TY1 above 111 is not out of the question. I would be more inclined to think maybe we give back 50% of that last fall which would mean something more like a move back over 110
However much more importantly the setup suggests that we could see renewed losses that could take us down towards 107-04 and then 105-10.
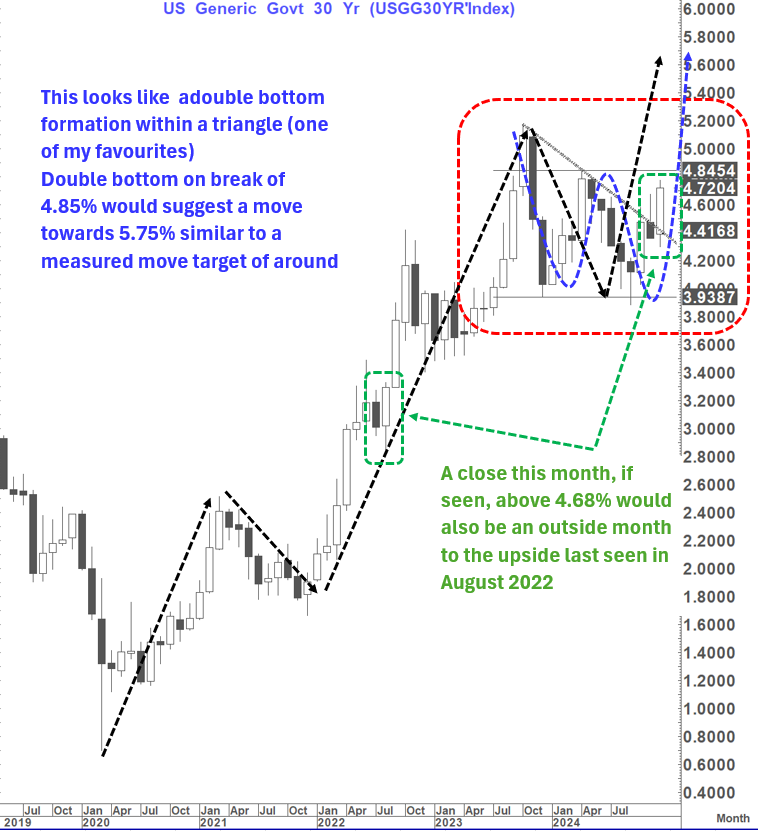
In fact, a repetition of 2023 would ultimately suggest new lows. In that respect it is worth looking at the 30-year yield chart.
This looks clearly like a double bottom withing a triangle (already broken) with a neckline at 4.85% and a break suggesting as high as 5.70-5.75%
This would clearly be material and is supported by the bullish picture on the US 2's 30's chart that suggests as high as +120 bp's as a target. In a pause the US 2-year yield should not deviate far from the mid-point of the Fed Funds rate at 4.365% so any steepening of this magnitude looks far more likely at this point to come from rising long-term yields.
However, it is hard for me to envisage this happening without some things breaking.
The fiscal position is unsustainable going forward in the way that we have seen in the last 4 years. A lot of republicans seem to be deficit hawkish (including the Treasury Secretary nominee so I suspect any fiscal easing plans may be harder to see unless they are self-financing. That in itself is hard given how much of the spending is now deemed untouchable.
Additionally, it is still not clear how "inflationary" the tariffs will be even if implemented.
Regulatory reform still looks very likely but that on its own is not enough.
The Fed is very cognizant of not making the same mistake twice, but I suspect that the decisions last week may yield the "Law Of Unintended Consequences" and via the long end of the curve induce a feedback loop that will ultimately hurt the economy, hurt the stock market and through rising unemployment possibly eventually hurt the property market eventually.
I have had a view for some time that the next "negative economic cycle" could come in 2023-2025 along the lines of the 17 year periods seen historically (1972-1975, 1989-1991, 2006-2008 and now 2023-2025) and I wonder at this point if unsustainable fiscal excess and the bond market may ultimately be the culprits in 2025 leading to a very different backdrop by the time the dust settles in 12 months' time.
So, for me, the two charts above are the ones I am most focused on as 2025 begins -with a not inconsequential danger that we see some "backing and filling" into the end of 2024 first.