We finally come to the "Week Of Reckoning" and on Friday possibly the most important data print of the year- The Employment report.
We all know that one single data print means little and given the recent payroll revisions that is particularly true for Non-farm Payrolls. Although, I do find it amazing that no sooner had the Birth-Death ratio component of payrolls been completely debunked (as it should be) than we have a plethora of people trying to debunk the revisions.
There is a level of denial out there that anything is "broken", We hear comments such as: Why is the Fed moving now when-
Inflation is at 3.2%. That is the CPI core which is not the Fed's focus. They focus on Core PCE which just printed at 2.6%. Still too high you say? That number printed at 5.6% in Jan 2022 and has pretty much been falling ever since. This puts it back into the 0.6% to 2.7% band that formed the range from 1993 to 2021 (28 years) and below levels seen in 2006 (The Fed's stubbornness worked out well back then)
In addition, the 3-month annualized rate is now around 1.7% and the 6-month annualised is down to 2.5%. It is the trend that counts. If we continue to print similar numbers to the last 4-months, then on a base effect we will not see the annual number rise and then in the first 5-months of 2025 we have a high base effect of about 0.35% per month allowing for likely further falls.
The Equity Market is close to its peak. Number 1, the equity market is not part of their mandate. Number 2, I have banged on incessantly about my 1990 and in particular 2000 and 2007 analogs in terms of backdrop, policy, markets and the economy. None of those years augured well for what came next.
The S&P hit an all-time high in July 1990 and then proceeded to fall 20% as the economy went into recession with banking and housing stress.
The S&P hit an all-time high in March of 2000 and retraced back close to that level on 01 September (Employment day) before entering into a bear market that lasted all the way into October 2002. It may well have bottomed earlier if it were not for 9/11 but the reality is that it was already down 30% by March 2001 as the Fed stubbornly held rates at their highs throughout 2000.
The S&P peaked hit an all-time high in July 2007 before falling 12% into August and then rallying again. It set a new all-time high on 11 October 2007 courtesy of the Fed cutting rates by 50 bp's on 18th September 2007 (The same date as the meeting this September). That all-time high was short-lived and a bear market which lasted all the way into March 2009 began. Long before the realization that this was the GFC it had fallen close to 20% by January 2008
The unemployment rate is still very low. It is true that the unemployment rate in July 1990 was much higher at 5.5% but in July 2000 it was 4% and in July 2007 4.6% (interestingly the average of those 2-years was 4.3%-exactly where we are now. But, in all 3 instances we were only on average 0.3% off the cycle low- now we are 0.9%. As always in markets and the economy it is the trend that is more important than the absolute level.
In addition, when we had those prior levels of unemployment (1990/2000/2007), we had a participation rate between 66% and 66.9%. The present participation rate is 62.7% relatively unchanged from when we were at 3.4% unemployment in April 2023. Since then, the number of people unemployed has grown by almost 1.5mm. In July 1990 that number was about 700k, July 2000 less than 300k and July 2007 about 422k.
The economy is still growing strongly. Yes, the last numbers reported a real GDP in Q2 of 3% but that is still open to revision and Q1 was just 1.4%. At the same time nominal GDP has collapsed in a virtual straight line from 17% in Q2, 2021 to 5.4% in Q1, 2023 (below the nominal Fed Funds rate for the first time in the cycle and even with the 3% real GDP of 3% (if fully realised) nominal GDP has only bounced to 5.9%. In Q2, 2007 it was 4.7%, in Q2, 2000 it was 7.6% (average above 6%) while in Q2, 1990 it was also 6.2%
So, to me I see nothing as yet that derails the analogs of 1990 and in particular 2000 and 2007 as a path similar to today.
We know that in all 3 periods the Employment data for August , released in September, was a watershed event.
All 3 times NFP printed negative. In 2 of the 3 periods (1990 and 2000) the unemployment rate also rose and was stable in 2007.
I do not think it is likely we print a negative number next week and anything short of a blockbuster number (and even then, it is only one number) will see Jay follow through with a 25 bp's cut on 18 Sept.
BUT, if it is a weak number - in my view sub 100k would qualify (the last time that print happened was in Jan 2021) AND/OR we get another rise in the unemployment rate then a 50 bp's move comes into play.
It is also worth knowing that the "ugly stepchild" or what I call the wallpaper pattern - The birth death ratio will only contribute around 100k + jobs to the total this month versus 246k last month. That is before the possibility that they reassess that number following the unprecedented revisions seen which are likely largely due (at least partly) to this "finger in the air" number being grossly inflated.
Prior to last year when amazingly the initial print in August was identical to that seen in July (Cue the skepticism) the August initial print has consistently been lower than the July initial print in 8 of the prior 10 years (As well as in 1990, 2000 and 2007)
In that respect I am repeating below the 2 grids I have recently sent out detailing what happened in markets/economy/policy leading into the August employment report in those periods and what happened after the weak print.
I still see this as the best roadmap and even if the report is O.K. (any one number can come out anywhere) a lot of these building blocks would still remain valid for now.
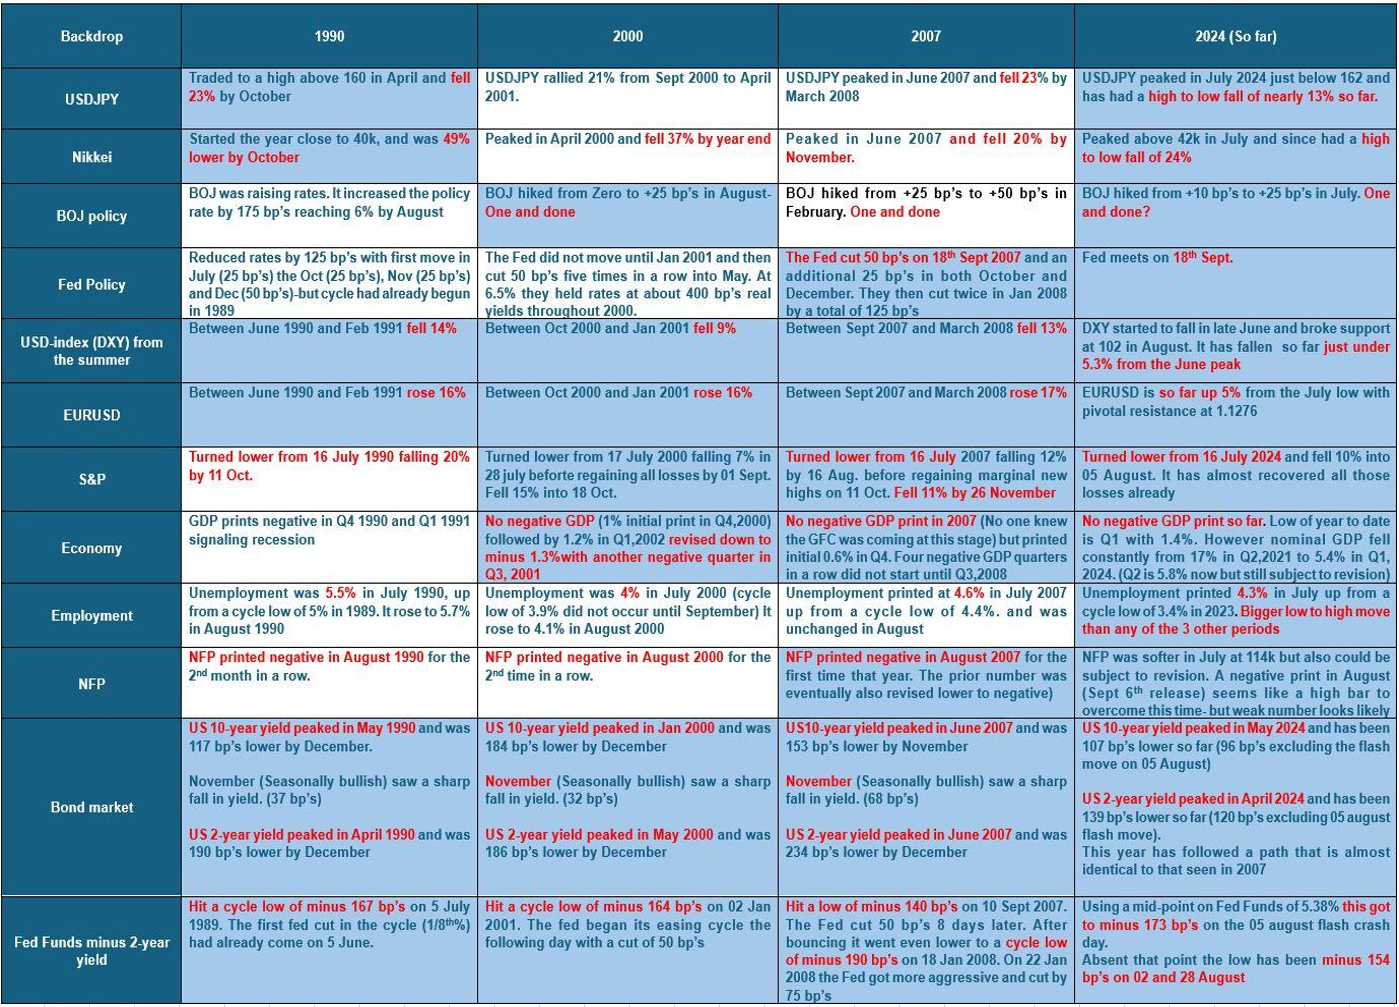
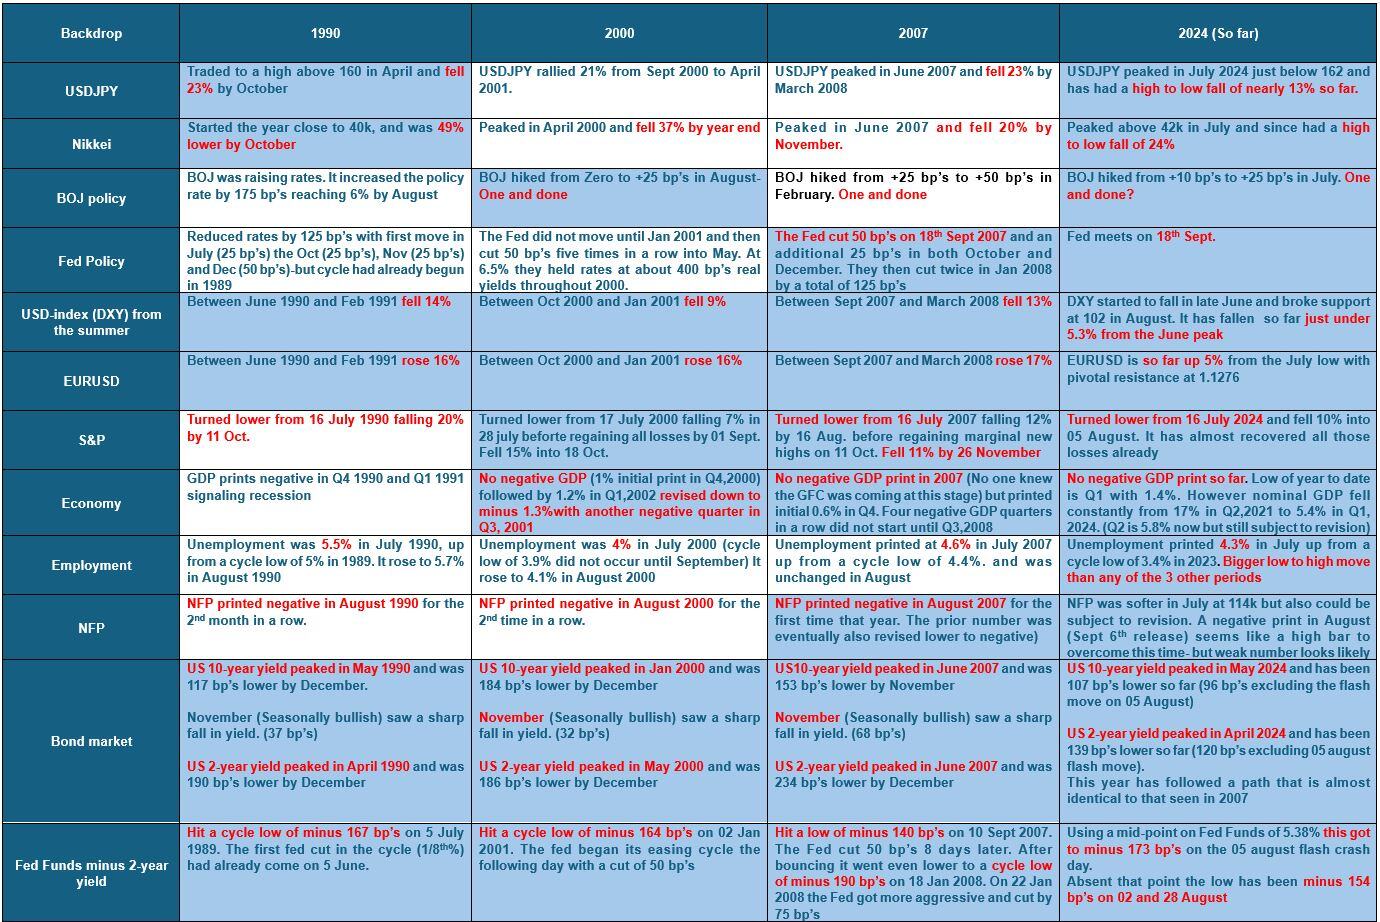
Path into the August Employment numbers in 1990,2000,2007.
Shaded in blue are the main similarities I see in those periods compared to today
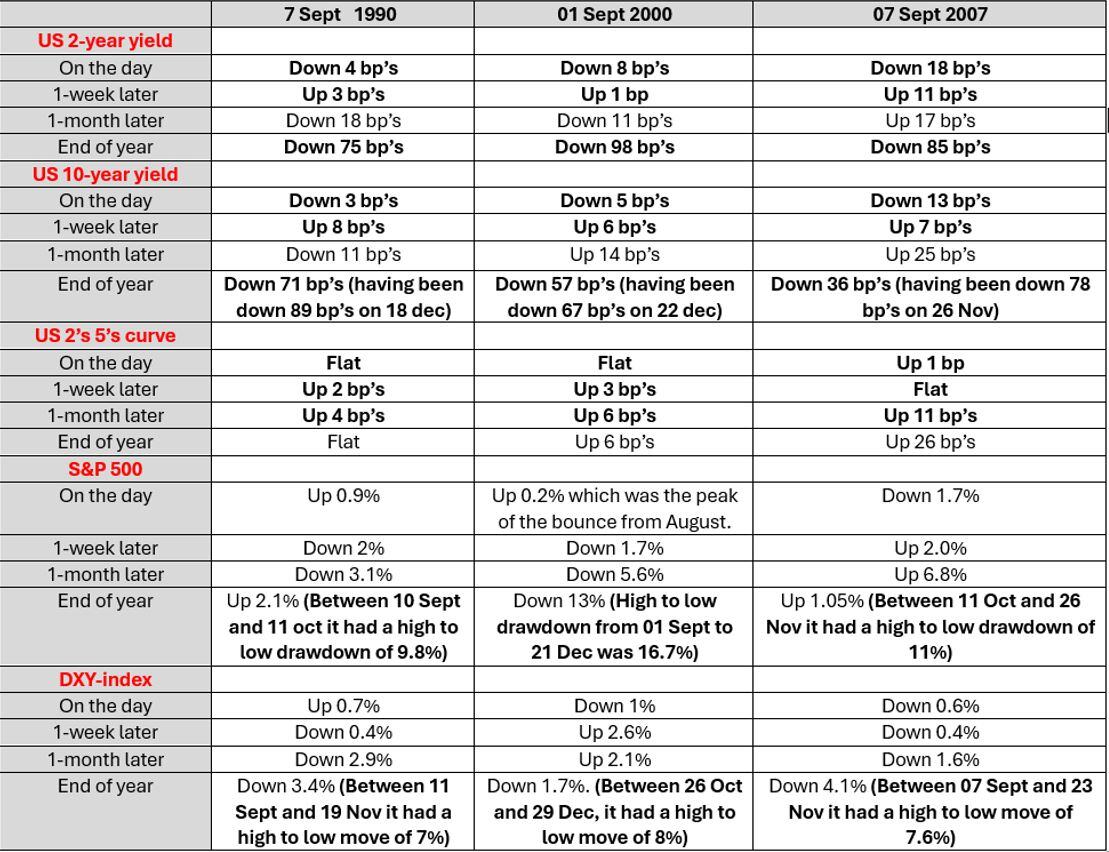
Path out of the August Employment numbers in 1990,2000,2007.
Bolded in black are the main similarities across those three those periods.