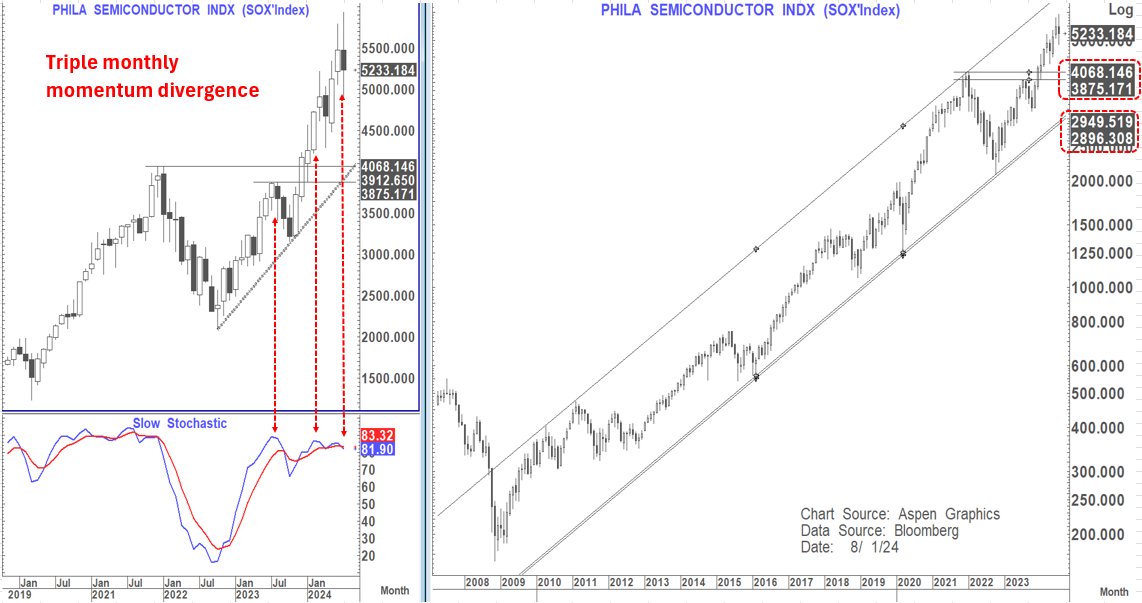
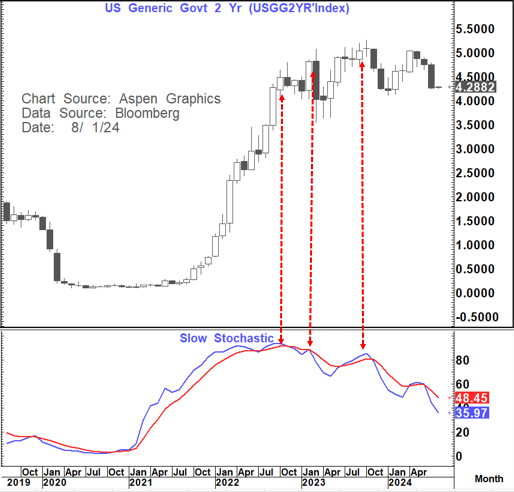
The last time we saw triple monthly momentum divergence at a trend peak was in the US 2-year yield at the high of 5.257% level in October 2023.
The picture on ES1 supports the contention that we could see a short-term equity market bounce.
I have beaten the drum many times (Including in the piece on 16th July title What is it about 17th July) about the similarity in the market/policy/economic backdrop to 2000.
On 17th July 2000 the S&P entered into a correction that took it 7% lower into month end before it started to bounce again while the NASDAQ fell 14% in the same period. This time around we saw Es1 fall (from exactly the same date) 5% into month end and the NASDAQ Composite 10.7%. The SOX fell 185 in the same period
I look at the SOX and the whole AI "Hype" as having a lot of similarities with the 2000 Dot Com bubble albeit not of the same magnitude of excess.
After the July 2000 month end lows, we saw a decent bounce higher that took us all the way through to 01 Sept ,2000 before the real fall began. Neither the S&P nor the NASDAQ managed to regain the old highs.
On ES1 at this time we see a clear double bottom formed yesterday that targets a move to at least 5,638 with the 76.4% pullback level at 5,653.
That looks like "as good a target as any" for this bounce
Other Stuff of note
USDJPY and a host of JPY crosses posted bearish outside months yesterday suggesting that much lower levels can be seen in the months ahead with the USDJPY, US-Japan rate policy, US-Japan rate spreads and Nikkei trading very like what we saw in 1990 after USDJPY rallied above 160.
For now, I would still be cautious about a possible ST bounce however before we head lower again. At least a move towards 151.90-95 looks possible and IF that gave way then maybe even 155.22-155.38 on USDJPY is possible.
EURUSD is also now coming under pressure and at least 1.07 and possibly below looks likely near-term. Support is met at 1.0699, 1.0666 and then 1.0601
Both the US 2-year and 5-year yields closed below the respective 76.4% retracement levels yesterday (monthly close) suggesting moves towards 4.12% and 3.75% respectively. For now, that suggests little movement on the 2's 5's curve albeit I still expect to see bull steepening here over time.
Gold has started to "firm up" again but so far held the 76.4% retracement level at $2453. Above there would open up the way for a return to the all-time highs at $2,484 and likely beyond. I still expect a move to at least $2,600+ here
WTI is bid again but this move is totally event driven and absent a ratcheting up of Geopolitical tensions to a new level (read direct attack by Iran that has a materially worse outcome than the last one)
good resistance is met between $78.58-$79.56