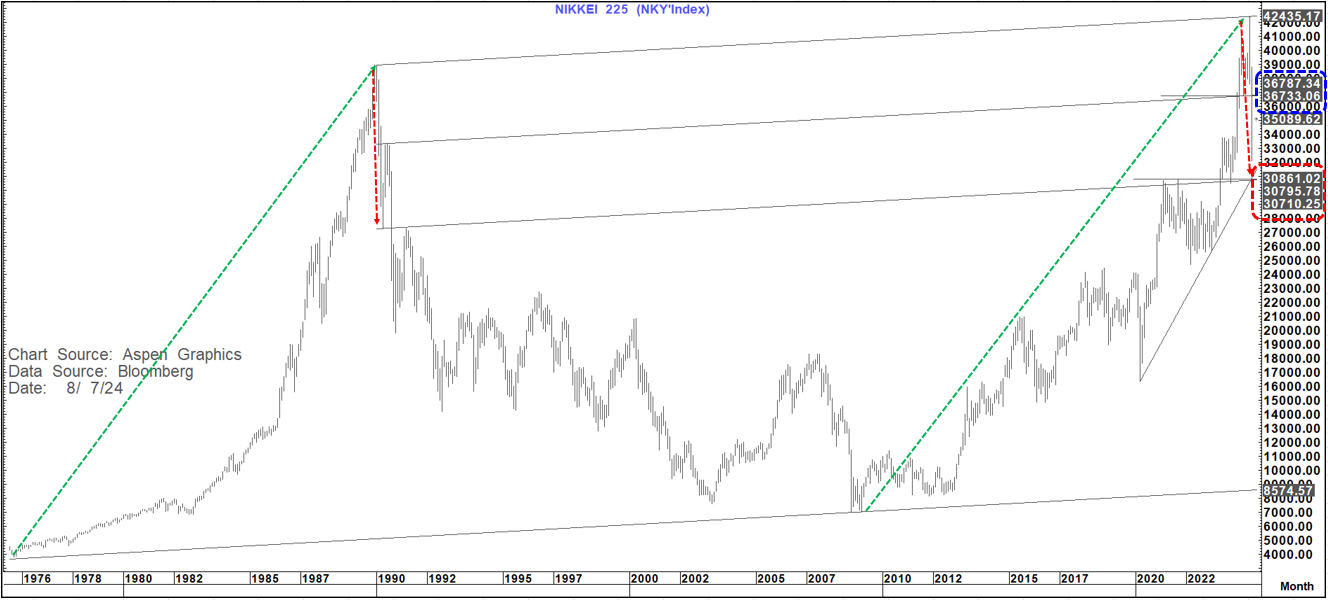
Bottom line, the "Ghosts of 1990" may re-emerge going forward 9and likely will) but for now they are in the background. In the coming days and maybe even the coming weeks into end August there is a real danger of a higher Nikkei and a higher USDJPY materialising as per above.
What about scenario 2? The Equity market and 2000?
On 17th July 2000 we saw the US Equity market move into a sharp correction that saw the S&P fall 7% into month end and the NASDAQ composite fall close to 18% into 03 August (Employment day).
The employment picture saw NFP miss and previous numbers revised down. This set the store for a sharp bounce (enthusiasm of a Fed reaction) that regained most of the losses by 01 Sept.
However, that was the point at which equity markets started falling again (September is by far the worst month for the equity market seasonally). This was a combination of the markets being way overvalued (Dot Com bubble) and the Fed being stubborn and refusing to cut rates.
I do not think we will get the latter and think the Fed may actually cut 50 bp's in Sept and 25 each in November and December. Despite that I think we will see that they are clearly behind the curve so the benefit to the Equity market may be limited past Sept-Oct.
The fall seen this time around in the S&P and NASDAQ is not that different to that seen in 2000 with the move also starting on 17th July. The S&P has fallen 9.7% and the NASDAQ Composite 16%
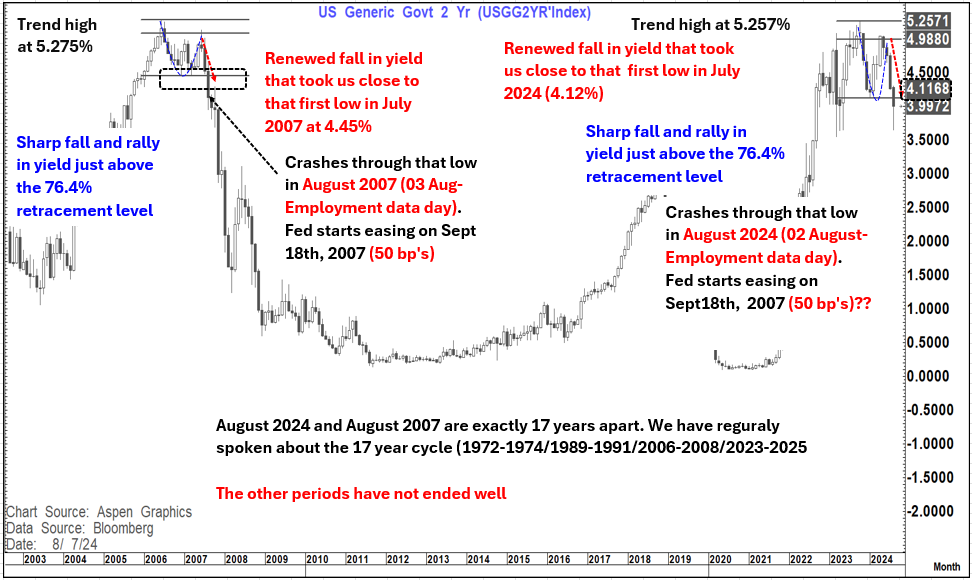
This brings us to scenario 3 - 2007 and the bond market and the Fed
In particular is the similarity that we have seen in the path of the US 2-year yield then and now.
After we broke below the pivotal support in 2007 at 4.45% (On employment day when we missed on NFP and saw revisions lower) we went another 64 basis points lower before then bouncing 48 bp's and then heading materially lower again.
This time around we broke below the 4.12% support level on employment day, went 47 bp's lower and have so far bounced 38 bp's. The magnitude and speed have been different here but likely distorted by the "Japan effect" but the underlying dynamics are not that different.
I would expect the 4.12-4.13% area to be significant resistance (yield) now- coincidentally 48 bp's off the low.
So where does that leave us?
As I always say, history does not repeat but it does rhyme. What market movements in recent weeks show us is that there is clearly some "stress in the system" with Japan showing that very clearly but also the reaction to the US employment data.
Despite the fact that they (BOJ) blinked last night we still have a 1990 scenario that has a lot of similarities with today and the roadmap should still be respected. For now it looks like we can see some relief which may take both the Nikkei and USDJPY higher near-term but as yet have no evidence that this roadmap has broken down.
In the US the 2000 equity market analog remains firmly in place and suggests some further respite in August.
But, whether you look at this analog and backdrop (Fed rates at 6.5% and Fed stubbornly holding until January, real yields at 400 bp's, Dot Com bubble and deterioration in Employment/economic picture) or the 2007 analog (2-year yield pattern, 2 year yield inversion to 160 bp's to Fed Funds, Fed easing on 18th Sept and easing 25 each at remaining meetings that year) the suggestion is that the equity market will likely see renewed stress in the Sept-oct period.
Bottom line with dynamics that "rhyme" with 1990, 2000 and 2007 it is hard to sit here today (as well as geopolitical dynamics that resemble the 1970's and a big domestic political focus starting to emerge) and expect that this is all just going to "calm down" and go away.
My suspicion is that we have a "false" calm that leads us into the August employment report on 06 Sept. In 2000 we saw another miss on NFP, and a rise on 1/10th in the unemployment rate and in 2007 (07 Sept) we also saw a miss and a stable unemployment rate.
This set the store for renewed "angst" in financial markets and still clearly looks like a good roadmap for today.